Reporting Area & Landscape Context
In this section we describe the reporting area and landbase where Norbord operates in Alberta.
Norbord's Operating Areas cover about 7.5% of Alberta's land area.
This predominantly forested region includes a diversity of forest types and wetlands. In addition to forest harvesting, large areas of the landbase are leased for oil and gas development.
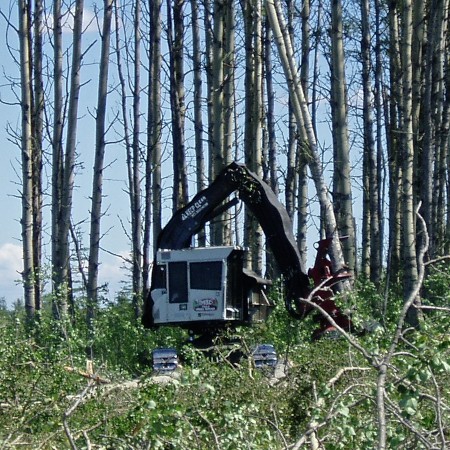 Photo: Norbord
Forest harvesting is one of several land uses in the region.
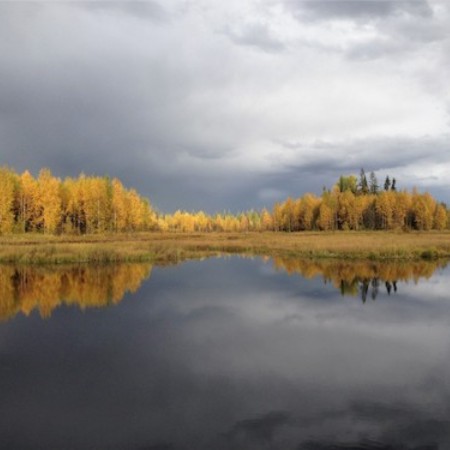 Photo: Nina Veselka
Wetland ecosystems cover about 35% of the Northern Operating Area.
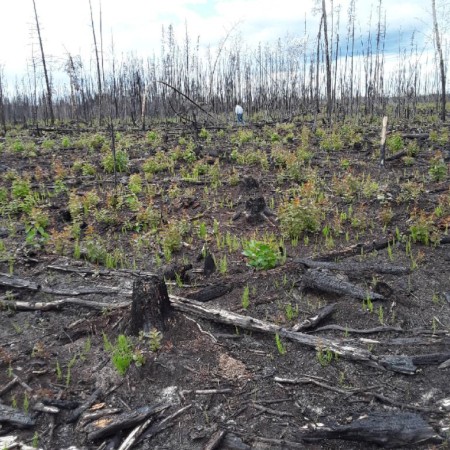 Photo: Norbord
Fire is the principal natural disturbance in montane and boreal forests.
Introduction
Norbord’s operating areas cover 50,181 km2 spread across two landscapes in northwestern Alberta—mainly boreal forest in the northwest corner of Alberta, and montane forests in areas around Grande Prairie. These regions are characterized by:
- Three of Alberta’s six Natural Regions including the Boreal Forest, Foothills, and Rocky Mountain Natural Regions.
- Vast forested areas of coniferous, mixedwood, and deciduous forests that support a wide range of plants and animals.
- In the northwest area, large numbers of wetlands, including bogs, meandering streams, and numerous lakes.
- Socially and economically valued activities including hunting, fishing, trapping, and other recreational pursuits.
Norbord only harvests deciduous trees (Trembling Aspen, Balsam Poplar, Birch). Other forest companies operating in the same Forest Management Agreement areas include other deciduous quota holders that mainly harvest deciduous trees and companies that harvest conifer species.

Norbord harvests deciduous trees including Trembling Aspen, Balsam Poplar, and Birch.
Norbord’s Operating Areas
Click on a topic to find out more about Norbord’s operating areas:
Areas of Analysis
At the request of Norbord, this report describes land cover and biodiversity in three areas of analysis.
 Northern Operating Area
- The Northern Operating Area is located in the northwestern corner of Alberta and covers an area of 39,168 km2; this area makes up 78% of Norbord’s total operating area in Alberta.
- Norbord shares management of this area with Tolko Industries Ltd and La Crete Sawmills Ltd.
 Southern Operating Area
- The Southern Operating Area covers approximately 11,013 km2 representing 28% of Norbord’s managed landbase.
- Norbord is a deciduous quota holder on two Forest Management Agreement (FMA) areas managed by Weyerhaeuser and Canadian Forest Products, respectively. Norbord works in cooperation with these two companies, as well as other forest companies, to sustainably manage forests in this region.
 Partner Operating Area
- The Partner Operating Area covers approximately 7,051 km2, in areas adjacent to the Southern Operating Area.
- This area is defined by portions of two FMA areas where Norbord does not hold deciduous quotas and therefore does not operate.
- Forest management planning occurs over the entire FMA areas.
Ecosystems
Norbord’s operating areas overlap a diversity of ecosystem types in northwestern Alberta including three Natural Regions and ten Natural Subregions. 78.3% of the operating areas overlap the Boreal Forest Natural Region followed by the Foothills Natural Region (19.0%) and Rocky Mountain Natural Region (2.7%). The distribution of these ecosystems is different in the Northern Operating Area compared to the Southern Operating Area.
 Northern Operating Area
The Northern Operating Area is located entirely in the Boreal Forest Natural Region. The dominant Natural Subregions include:
- Central Mixedwood (44.4%);
- Lower Boreal Highlands (23.1%);
- Northern Mixedwood (15.3%), and;
- Dry Mixedwood (12.1%).
The Boreal Subarctic (3.6%), and Upper Boreal Highlands (1.4%) cover small areas.
 Southern Operating Area
The Southern Operating Area overlaps three natural regions:
- The Foothills Natural Region covers 68.6% of the Southern Operating Area. Broken down into natural subregions, the Lower Foothills and Upper Foothills cover 54.8%, and 13.8% of the Southern Operating Area, respectively.
- Boreal Forest covers 29.5% of the Southern Operating Area. This is mainly composed of the Central Mixedwood Natural Subregion which occupies 23.5% of the Southern Operating Area.
- Rocky Mountain, at 1.9%, only covers a small area.
While Norbord’s operating areas occupy 7.5% of Alberta’s total land area, they contain 33.5% of Alberta’s Lower Foothills Natural Subregion; this Subregion is also underrepresented in protected areas at 2.8%. As a result, responsibility for this Subregion is higher.
| Northern Operating Area | Southern Operating Area | Alberta | ||||
| Natural Region | Natural Subregion |
Area (km2) |
Area (%) |
Area (km2) |
Area (%) | % Managed as Protected Area |
| Boreal Forest | Central Mixedwood | 17,388 | 44.4 | 2,586 | 23.5 | 13.6% |
| Lower Boreal Highlands | 9,059 | 23.1 | - | - | 8.4% | |
| Northern Mixedwood | 6,008 | 15.3 | - | - | 44.8% | |
| Dry Mixedwood | 4,727 | 12.1 | 655 | 6 | 1.6% | |
| Boreal Subartic | 1,427 | 3.6 | - | - | 49.4% | |
| Upper Boreal Highlands | 558 | 1.4 | - | - | 1.8% | |
| Foothills | Lower Foothills | - | - | 6,037 | 54.8 | 0.8% |
| Higher Foothills | - | - | 1,516 | 13.8 | 2.8% | |
| Rocky Mountain | Subalpine | - | - | 148 | 1.3 | 55.8% |
| Montane | - | - | 71 | 0.6 | 30.2% | |
Wetlands
Wetlands are an integral part of the landscape as they provide a number of important benefits. Ecologically intact wetlands, and their associated biodiversity, act as a catalyst for the physical, chemical, and biological processes that:
- provide clean water;
- mitigate flood and drought events;
- recharge ground and surface water;
- capture and store carbon;
- recycle nutrients;
- support high level of primary productivity, and;
- provide critical wildlife habitat.
Wetlands add habitat complexity at local and regional scales through the creation of micro-habitats, edge effects, and localized microclimates which support a high level of biodiversity, both in the wetland and the surrounding landscape.
- In the Northern Operating Area, wetlands are common, covering 35.3% of the land base.
- Fen (also known as muskeg), is the most common wetland class, covering 21.7% of the Northern Operating Area, followed by swamp (5.6%), and bog (4.9%) wetland classes. Marsh and open water wetland classes each cover < 2.0% of the area
- Wetlands are much less common in the Southern Operating Area and Partner Operating Area, covering 5.2% and 4.8% of each area, respectively. Fen and swamp are the most common wetland classes in these areas.
| Northern Operating Area | Southern Operating Area | Partner Operating Area | ||||
| Wetland Class | Area (km2) | % Area | Area (km2) | % Area | Area (km2) | % Area |
| Bog | 1,914 | 4.9 | 22 | 0.2 | 15 | 0.2 |
| Fen | 8,482 | 21.7 | 336 | 3.1 | 183 | 2.6 |
| Marsh | 570 | 1.5 | 24 | 0.2 | 15 | 0.2 |
| Open Water | 679 | 1.7 | 69 | 0.6 | 38 | 0.5 |
| Swamp | 2,189 | 5.6 | 119 | 1.1 | 85 | 1.2 |
| All Wetlands Combined | 13,834 | 35.3 | 570 | 5.2 | 39 | 4.8 |
Fire History
Fire is the principal natural disturbance in northwestern Alberta; it is the dominant natural disturbance in both boreal forest and foothill forest ecosystems. In these forests, fires—along with other natural disturbances like insect outbreaks and disease—result in a mosaic of stands of different ages from young forests to forests more than 150 years old. This mosaic of ages helps maintain biodiversity across northwestern Alberta.
Highlights
- 35.1% of the Northern Operating Area has burned since the 1940s, compared to 11.8% of the Southern Operating Area.
- Most of the fire disturbance in the Southern Operating Area occurred in the 1940s and earlier; only small areas have burned since then.
- In contrast, over 5,000 km2 (13.0%) of the Northern Operating Area has burned since 2010.
- With the exception of the 1940s, a higher percentage of the Northern Operating Area has burned in each decade compared to the Southern Operating Area.
- The different fire regimes in the Northern and Southern areas have potentially large implications for biodiversity. The different effects of recent fires, along with other landbases, on habitat elements and birds, are examined in the following section Sections: 3.3, 3.4, 4.2, and 4.3.
| Northern Operating Area | Southern Operating Area | |||
| Decade* | Area of Fire (km2) |
% of Area | Area of Fire (km2) |
% of Area |
| 1940s | 543 | 1.4 | 561 | 8.0 |
| 1950s | 2,069 | 5.3 | 132 | 1.9 |
| 1960s | 305 | 0.8 | 27 | 0.4 |
| 1970s | 168 | 0.4 | 7 | 0.1 |
| 1980s | 3,613 | 9.2 | 12 | 0.2 |
| 1990s | 1,467 | 3.7 | 3 | 0.0 |
| 2000s | 491 | 1.3 | 5 | 0.1 |
| 2010s | 5,081 | 13.0 | 34 | 0.5 |
| Total | 13,737 | 35.1 | 1,305 | 11.8 |
Forest Timber Volume and Carbon Storage
Introduction
Forest ecosystems play an important role in the carbon cycle by both storing carbon (carbon sink) and releasing carbon (carbon source):
- Forests act as carbon sinks by removing carbon from the atmosphere through photosynthesis and the growth of trees; forest ecosystems are natural storehouses of carbon.
- Forests can act as a carbon source through natural processes, such as wildfire and insect outbreaks, which result in the death and decay of trees and the release of carbon into the atmosphere.
Forestry activities also impact the carbon cycle in a number of ways (e.g., harvesting, reforestation activities, processing timber). In addition, carbon continues to be stored in wood products once trees are harvested. Understanding how both natural processes and human activities impact carbon storage is important to manage forests as a carbon storehouse and moderate the impacts of climate change.
Forest timber volume and forest carbon storage information help the forest sector to understand the interaction between timber production activities and the associated changes to forest carbon stores.
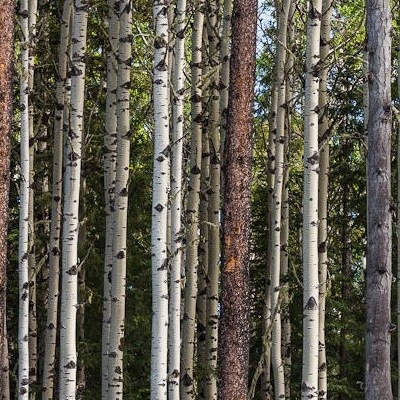 Photo: Jonathan Martin DeMoor
Methods
Using the Carbon Budget Model (CBM-CFS3) of the Canadian Forest Sector[1,2] and by considering variations in forest stand age and forest type[3], the average amount of forest standing timber volume (m3/ha) and CO2-equivalent of forest carbon stored above- and below-ground (tonnes of CO2/ha) was estimated for the year 2010 and at the 800 m grid-scale across the Norbord Operating Areas[4,5]. Note the model does not address the rate at which carbon sequestered in wood products is released back to the atmosphere as CO2, which can vary widely, from years to decades, depending on the wood products and their use. For more information visit: https://ecosystemservices.abmi.ca/.
Results
- Across Norbord’s Operating Areas, the total amount of forest standing timber volume and forest carbon storage were estimated to be around 705M cubic meters and 3.8B tonnes of CO2-equivalent, respectively.
- The noticeably larger Northern Operating Area was estimated to contain more forest standing timber volume and forest carbon storage compared to the Southern Operating Areas.
Implications for Forest Management
- The estimated baseline values of forest timber volume and forest carbon storage can support the development of forest conservation strategies and sustainability reporting and certification frameworks. The baseline information also serves as a starting point to understand potential future changes to forest carbon stores.
- The economic value of the estimated carbon stores can be evaluated based on a user-defined carbon price, allowing forest managers to understand how forestry activities can affect the amount and value of carbon stored in forests.
| Standing Timber Volume | Forest Carbon Storage | |||||
| Operating Area | Average (m3/ha) |
Total (m3) |
Per cent (%) | Average (tonnes of CO2e/ha) |
Total (tonnes of CO2) |
Per cent (%) |
| Northern | 147 | 547,465,000 | 78 | 770 | 2,932,124,000 | 76 |
| Southern | 144 | 157,914,000 | 22 | 829 | 912,506,000 | 24 |
| Total | 145.5 | 705,379,000 | 800 | 3,844,630,000 | ||
References
Kurz, W.A., C.C. Dymond, T.M. White, G. Stinson, C.H. Shaw, G.J. Rampley, C.E. Smyth, B.N. Simpson, E.T. Neilson, J.A. Trofymow, J.M. Metsaranta, and M.J. Apps. 2009. CBM-CFS3: a model of carbon dynamics in forestry and land-use change implementing IPCC standards. Ecological Modelling, 220(4): 480-504.
Kull, S.J., G.J. Rampley, S. Morken, J. Metsaranta, E.T. Neilson, and W.A. Kurz. 2011. Operational-scale carbon budget model of the Canadian forest sector (CBM-CFS3) version 1.2. Natural Resources Canada, Canadian Forest Service, Northern Forestry Centre.
Natural Resources Canada. 2006. Canada's National Forest Inventory: Area, Gross Total Volume by Forest/Non-forest, Forest Type, Age Class. https://nfi.nfis.org/home/php?lang=en
Kennedy, M., A.J.K. Vandenbroeck, and J. Wilson. 2014. Timber and carbon geosimulation modeling platform. Prepared for the ABMI Ecosystem Service Assessment Project.
Habib, T.J., S. Heckbert, J.J. Wilson, A.J.K. Vandenbroeck, J. Cranston, and D.R. Farr. 2016. Impacts of land-use management on ecosystem services and biodiversity: an agent-based modeling approach. PeerJ 4:e2814 https://doi.org/10.7717/peerj.2814.


