How Changes in the Landbase Affect Individual Bird Species
In this section we evaluate how landbase changes (e.g. new forestry footprint, fire) from 2010-2018 in Norbord's operating areas are predicted to affect individual birds species.
Predicted net change in relative abundance as a result of changes in the landbase (2010-2018):
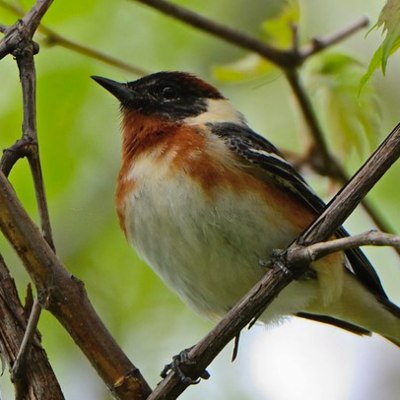
Bay-breasted Warbler
North: -2.5% | South: -1.9%
Brown Creeper
North: -0.4% | South: +3.0%
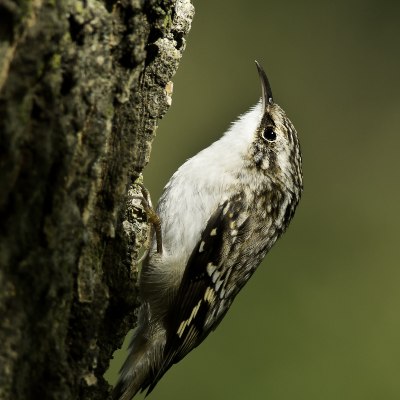_Certhia%20americana-1.jpg)
Ovenbird
North: -2.1% | South: -4.6%
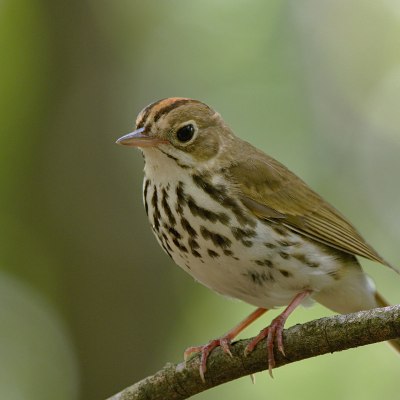.jpg)
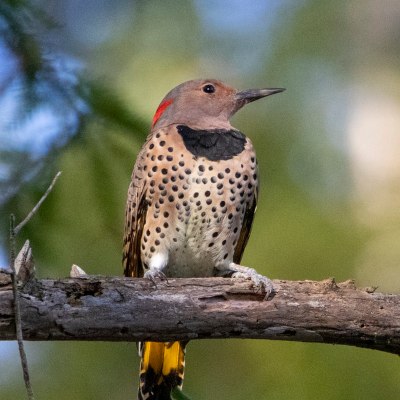
Northern Flicker
North: +9.2% | South: +5.9%
Introduction
In this section we provide summaries of the overall predicted change in a species due to different types of change on the landbase, including changes as a result of forestry (new and old), non-forestry footprint (new and old), fire, and aging of undisturbed stands. Results are presented for three bird species associated with mid-age to old forest habitat: Bay-breasted Warbler, Brown Creeper, and Ovenbird. Results are also presented for the Northern Flicker, a cavity-nesting bird which is abundant in young naturally disturbed and harvested stands. Details for calculating attribution can be found in the Methods.
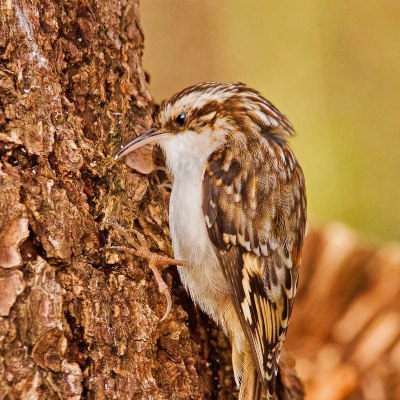
Brown Creeper (Certhia americana)
Results
Effects of Landbase Change on Individual Bird Species
We use “vector diagrams” to show the effects of each type of landbase change on four example bird species in the three operating areas: Bay-breasted Warbler, Brown Creeper, Ovenbird, and Northern Flicker. To interpret the vector diagrams, follow the arrows from the top of the figure, starting at 0% change, to the bottom to see the predicted effects on the species of:
- new forestry, then
- the additional effect of old regenerating harvest areas, then
- new non-forestry human footprint, then
- changes or disappearance of old non-forestry human footprint, then
- fires, and finally
- aging of undisturbed native forest.
The endpoint is the net change predicted in that species from 2010 to 2018.
Click on a bird species to see the effects of landbase change

Bay-breasted Warbler is associated with older forests, particular white spruce and mixedwood.
Northern Operating Area
- New forestry was predicted to have reduced the abundance of the Bay-breasted Warbler by -4.8% between 2010 and 2018.
- Regenerating older harvest areas added 0.8% of that back.
- Other human footprint is rarer in the area and had little effect.
- Fires reduced the predicted abundance a further 2.5%, while aging of undisturbed stands increased the population by 3.9%.
- The net effect was a -2.8% change in the predicted abundance of the Bay-breasted Warbler due to landbase changes from 2010 to 2018 in the Northern Operating Area.
Southern Operating Area
- In the Southern Operating Area, new forestry had a similar predicted reduction of -5.2% in the Bay-breasted Warbler, compared to the Northern Operating Area.
- With a longer history of older forestry, there was a greater positive contribution from regenerating old harvest areas (+1.5%) than in the Northern Operating Area.
- More new non-forestry human footprint reduced the species in the Southern Operating Area a further -1.1%.
- Fires were largely absent in this area, and therefore had no effect on relative abundance.
- Aging of undisturbed stands increased the population by 3.0%.
- The net change of -1.9% in the Southern Operating Areas was less change than in the Northern Operating Area. This was due to lack of fires in the south as well as greater regeneration of old harvest areas.

Brown Creeper is associated with older stands of all forest types. It shows a large increase in habitat suitability from mid-seral to mature stands, which is the age class of many native stands in Norbord’s operating areas.
Northern Operating Area
- New forestry is predicted to have reduced the Brown Creeper by 6.8%.
- Regenerating harvest areas make little contribution because these areas are not old enough to be suitable for this species.
- Other human footprint types are rare in the area.
- Fires further reduced the predicted abundance by 4.3%.
- However, the aging of many mid-seral to mature stands produced large predicted increases in habitat suitability (+10.6%) for the Brown Creeper.
- In the Northern Operating Area, this improvement due to aging almost exactly compensated for the reductions from forestry and fire, producing very little predicted net change in Brown Creeper relative abundance from 2010 to 2018.
Southern Operating Area
- Results are similar in the Southern Operating Area for Brown Creeper, except for the lack of fires.
- New forestry produced a predicted reduction of 9.6% between 2010 and 2018.
- Despite the longer history of forest harvest in the south, regenerating older harvest areas are still too young to contribute much new suitable habitat.
- New non-forestry human footprint reduced the species a small amount.
- In the absence of fires, aging undisturbed forest (+13.1%) more than compensated for forestry reductions, producing a net change of +3.0% in the Southern Operating Area. The large cohort of early-mature stands in this landbase becoming highly suitable Brown Creeper habitat is a major factor.

Ovenbirds are associated with mid-age forest stands, particularly deciduous forests. Habitat quality is high in deciduous and mixedwood forests after 20 years of age, peaking at 40-80 years in stands originating from natural disturbance as well as regenerating harvested areas.
Northern Operating Area
- In the Northern Operating Area, new forestry is predicted to reduce the Ovenbird by 1.5%, but the rapid recovery of habitat quality means that regenerating older harvest areas (+1.4%) almost exactly compensate for the reductions in new forestry areas.
- Other human footprint is unsuitable but there was only a small amount of other landbase disturbance in the Northern Operating Area between 2010 and 2018.
- Fires in this area were predicted to have lowered Ovenbird populations by about 1.1%.
- In contrast to the old-forest bird species, the large cohort of early-mature forest is aging out of suitability for this species, so aging forests (-0.8%) produced a predicted reduction in Ovenbirds.
- The result of all the landbase changes in the Northern Operating Area resulted in a predicted net loss of 2.1% in the Ovenbird population between 2010 and2018, dominated by the effects of natural changes, including fire and forests aging.
Southern Operating Area
- New forestry (-4.2%) was predicted to have a larger negative effect on Ovenbird populations in the Southern Operating Area than in the north, with regenerating older harvest areas (+3.2%) not fully compensating for that reduction.
- Non-forestry human footprint also produced a 0.9% predicted reduction in this area.
- Aging of undisturbed stands (-2.6%) mainly into less suitable older age classes further reduced the Ovenbird.
- The predicted net effect was a -4.6% change in the Ovenbird population in the Southern Analysis Area, almost equally attributable to human footprint and natural changes.

Northern Flicker is associated with all types of young forests originating from both natural disturbance (e.g., fire) and from forest harvest. This leads to landbase attribution results that are almost directly opposite those of old-forest species like Bay-breasted Warbler.
Northern Operating Area
- In the Northern Operating Area, the Northern Flicker population was predicted to increase substantially due to new forestry (+4.6%) from 2010 to 2018, and be reduced modestly in older harvest areas (-1.7%) as these stands regenerated into less suitable habitat.
- Other human footprint is rare and not particularly favoured by this species, so had little predicted effect.
- Fires in the Northern Operating Area produced a large predicted increase of almost 10%.
- Aging of undisturbed forest (-3.3%) had a relatively smaller negative effect because the many early-mature stands were already unsuitable.
- The net result of landbase change was a predicted increase in the Northern Flicker population of 9.2% in the Northern Operating Area.
Southern Operating Area
- The Northern Flicker population in the Southern Operating Area showed larger changes than in the north because of the larger areas of forestry activities in the south. This species was predicted to increase by 12.4% as a result of new forestry, which was partially offset by a reduction of 6.2% by regenerating old forestry.
- With little other human footprint and almost no fires, the only other change was a small predicted loss due to the aging of undisturbed stands (-1.0%), which were mostly unsuitable for this species to begin with.
- The net result of landbase change was a predicted +5.9% change in the Northern Flicker population in the Southern Operating Area, less than in the Northern area due to the lack of fires.
This report is in partnership with