Attributing Landbase Change: How Changes in the Landbase Affect Habitat Elements
In this section we evaluate how landbase changes (e.g. new forestry footprint, fire) from 2010-2018 in Norbord's operating areas are predicted to affect abundance of habitat elements, such as vegetation cover and large trees.
In the Northern and Southern Operating Areas, most habitat elements were predicted to decrease as a result of landbase change.
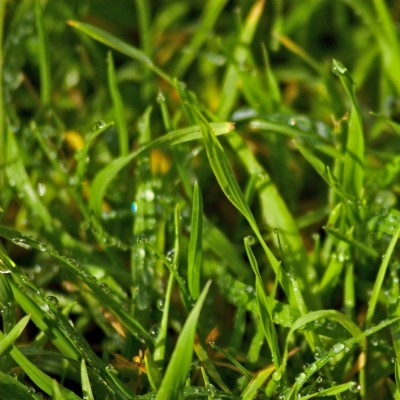 Photo: Bruce Aldridge
Grass cover
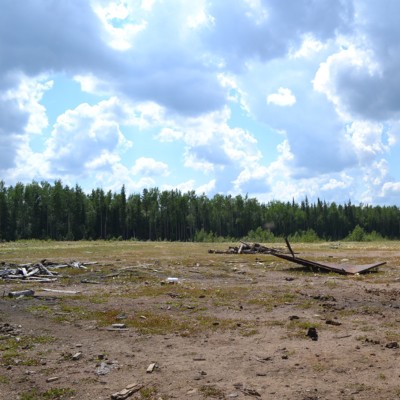 Photo: ABMI
Bare ground
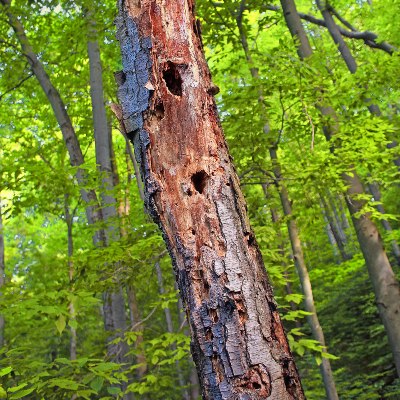.jpg) Photo credit: Nicholas A. Tonelli
Photo credit: Nicholas A. Tonelli
Deciduous snag
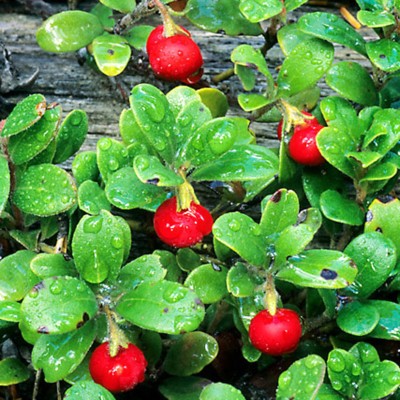 Photo: ABMI
Shrub cover
Introduction
In this section, we provide summaries of the overall predicted change in habitat elements to different types of change on the landbase, including changes as a result of forestry (new and old), non-forestry footprint (new and old), fire, and aging of undisturbed stands. In this section, we present roll-up figures for all habitat elements showing the effects of:
- New versus regenerating old forestry;
- Fires versus aging undisturbed stands;
- Net human footprint versus net natural changes.
Details for calculating attribution can be found in the Methods.
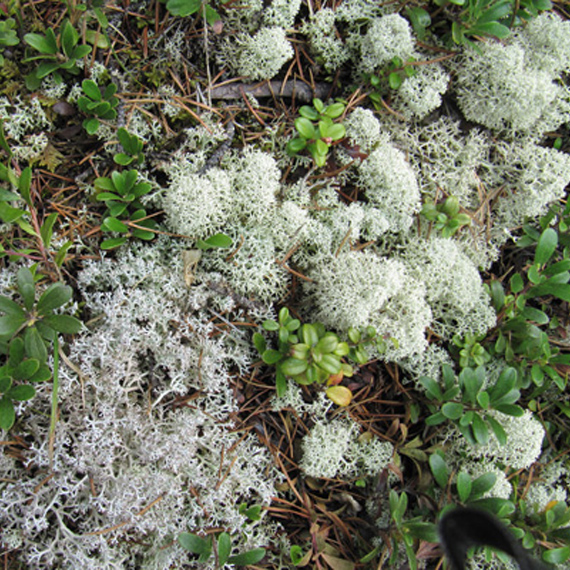
Lichen cover
Results
Effects of Landbase Change
To view how different types of landbase change affect habitat elements in Norbord's operating areas, click on a section to explore results.
- New Forestry vs Old Harvest Areas
- Fire vs. Aging of Undisturbed Natural Stands
- Human Footprint vs. Natural Change
New Forestry versus Regeneration of Old Harvest Areas
Highlights
- In the Northern Operating Area, the net effect of new and regenerating forestry is negative for most habitat elements (below green line). Many of these elements are directly removed as a result of forestry activities (e.g. live trees), or respond negative to changes in habitat (e.g. moss cover).
- In contrast, in the Southern Operating Area, the reduction of many habitat elements as a result of new forestry is almost directly offset by aging of old harvest areas. Like the Northern Operating Area, there are some habitat elements that are negatively impacted by new forestry which have not yet recovered in new forestry footprint.
Fires versus Aging of Undisturbed Native Stands
Highlights
- Changes in abundance of many habitat elements due to fire were offset by changes due to natural stands aging. Small dead trees increased greatly as a result of recent fires while others showed moderate increases (above green line on left side of graphs).
- Some elements—such as large snags, trees, and fallen logs—that are more abundant in older forest also showed predicted strong increases due to aging; these increases outweighed losses in burned areas (above green line on right side of graphs).
- Habitat elements that decreased (below green line) were mainly lowland conifer categories; there may have been more fires in lowland forests resulting in these decreases.
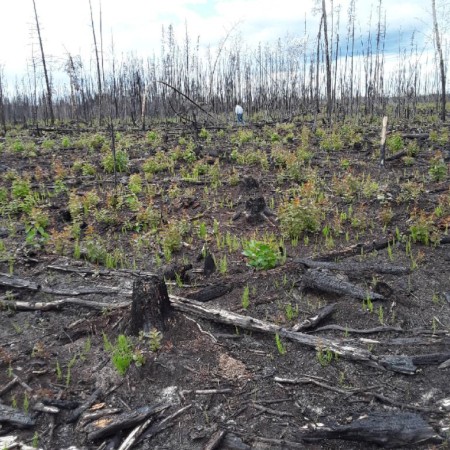
Forest fires are the predominant natural disturbance in boreal and montane forests.
Net Effect of Human Footprint versus Net Natural Change
Highlights
- A slight majority of analyzed habitat elements showed a net reduction due to natural and/or human-caused disturbance (indicated by points below green line). These are mainly live trees that are expected to decrease as a result of disturbances.
- In the Southern Operating Area, large changes were mainly associated with changes in human footprint, which is mainly forestry; predicted changes in relative abundance ranged from -10.7% (large conifers >25 cm dhb) to +5.4% (bare ground). There is also generally more natural change than in the North with predicted changes in the South ranging from -7.1% (lowland conifers <7 cm dbh) to +5.9% (dead deciduous >25 cm dbh).
- In the Northern Operating Area, net change from all human footprint (-7.0% to 8.6%) had more effect than did natural changes (-2.7% to +4.6%).
This report is in partnership with