Vegetation Type: Status & Trend
In this section we summarize the status and trend of vegetation types in Norbord's operating areas.
The status of undisturbed deciduous and mixedwood forest, circa 2018, was:
 Northern Operating Area
Deciduous = 23.8% | Mixedwood = 4.7%

Southern Operating Area
Deciduous = 29.8% | Mixedwood = 7.8%

Introduction
“Coarse-filter” management is one tool recommended for maintaining biodiversity in managed landscapes. By managing for vegetation (forest) types in patterns and amounts similar to natural disturbance such as fire and insect outbreaks, it is more likely that many components of biodiversity will also be maintained. Therefore, documenting and mapping vegetation types is critical to understanding how human activity, including forestry, is affecting ecosystems, and to supporting sustainable, evidence-based land-use decisions (e.g., forest management planning)[1]. Tracking vegetation types is important to:
- detect changes in the extent and distribution of native vegetation,
- develop species-habitat association models, and
- explain trends in biodiversity.
Native vegetation is summarized for Norbord’s operating areas, including vegetation type, amount, and trend. This “coarse-filter” monitoring of native vegetation complements the “fine-filter” monitoring of species by providing detailed information on habitat changes, a main driver of species changes.
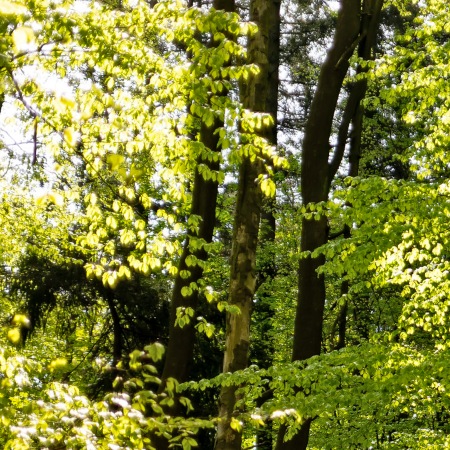 Photo: Dano
Results
Area of Native Vegetation Types
Major vegetation types differ between the Northern and Southern Operating Areas because of the different ecosystem types that predominate in each landbase.
- In the Northern Operating Area, which is located entirely in the Boreal Forest Natural Region, the majority of the landbase is covered by the following forest stand types: deciduous (23.8%), black spruce (21.3%), white spruce (4.9%), mixedwood (4.7%), and pine (2.3%).
- Non-harvestable vegetation types are common in the Northern Operating Area including non-forested vegetation cover (20.2%) and treed fen (14.0%).
- In the Southern Operating Area, which overlaps three natural regions (Boreal Forest, Foothills, and Rocky Mountains), almost 60% of the landbase is covered by the following forest stand types: deciduous (29.8%), white spruce (8.9%), mixedwood (7.8%), pine (6.8%), and black spruce (5.6%).
- Non-harvestable vegetation types cover small areas including non-forested vegetation (5.6%) and treed fen (5.0%).
Results
Trend in Native Vegetation Types
Major vegetation types differ between the Northern and Southern Operating Areas because of the different ecosystem types that predominate in each landbase.
- Pine and deciduous forests showed the largest declines in the Southern Operating Area; pine decreased by 7.1 percentage points (13.8% to 6.6%) and deciduous decreased by 3.8 percentage points (33.4% to 29.5%) between 2000 and 2019.
- Except for white spruce (2.1%), all forest types in the Northern Operating Area had declines < 1.5 percentage points between 2000 and 2019.
- Forest harvest is a driver of decreases in deciduous, mixedwood, white spruce, and pine stand types.
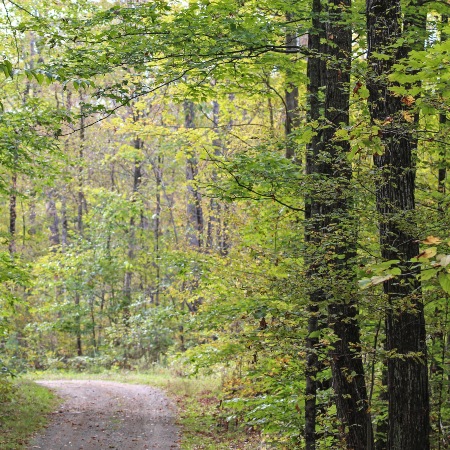
Deciduous forest
References
Noss, R.F. 1999. Assessing and monitoring forest biodiversity: A suggested framework and indicators. Forest Ecology and Management 115(1999):135-146.
This report is in partnership with