Status of Overall Biodiversity
In this section we summarize the status of overall biodiversity based on the Biodiversity Intactness Index.
The status of overall biodiversity as measured by the Biodiversity Intactness Index was found to be, on average:
![]()
94.9%
Northern Operating Area
![]()
85.8%
Southern Operating Area
- This means much of the habitat for biodiversity is in good condition across Norbord's landbase, but habitat suitability is lower in some areas due to human development activities.
- Habitat suitability is higher in the Northern Operating Area because there is less human footprint in this landbase compared to in the Southern Operating Area.

Introduction
The Biodiversity Intactness Index summarizes the current status of species. Intactness compares a species’ predicted abundance in the current landscape to its predicted abundance in a reference landscape where human footprint has been removed (“back-filled”) and the vegetation type that existed prior to human footprint has been estimated based on best available information [1]. Intactness therefore shows the degree to which human footprint has affected a species as a result of changes to habitat suitability. Habitats with minimal disturbance have high intactness scores compared to highly modified habitats, which have low intactness scores. Details for calculating intactness can be found in the Methods.
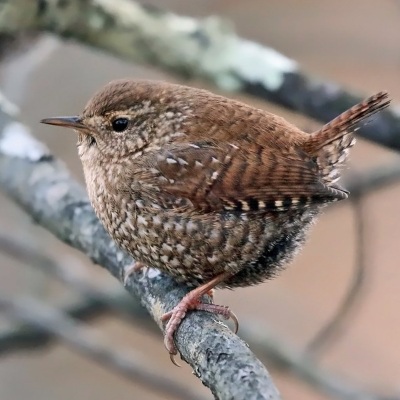 Photo: Tom Murray
Winter Wren (Troglodytes hiemalis)
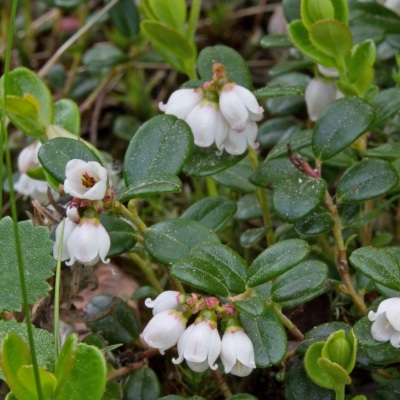 Photo: Arthur T. Labar
Lowbush Cranberry (Vaccinium oxycoccos)
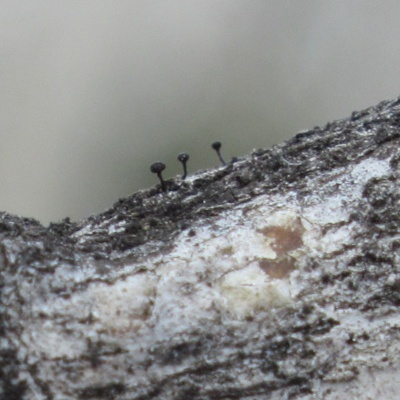 Photo: Diane Haughland
Poplar Needles Lichen (Phaeocalicium populneum)
The predicted effects of human disturbance on overall biodiversity as measured by the Biodiversity Intactness Index are summarized for Norbord's operating areas.
Results
Biodiversity Intactness
The overall intactness of common native species as measured by the Biodiversity Intactness Index was found to be, on average:
Northern Operating Area
![]()
94.9%
615 species
Southern Operating Area
![]()
85.8%
625 species
Partner Operating Area
![]()
91.0%
624 species
Highlights
- In the Northern Operating Area, intactness levels for taxonomic groups were similar, ranging from 93.7% intact for lichen to 95.7% for vascular plants and mosses.
- Intactness was lower for all taxonomic groups in the Southern Operating Area compared to the north, ranging from 83.1% intact for birds to 89.5% for mammals. This difference is due to higher footprint in the south.
- Habitat suitability for the majority of lichen and moss species was lower than expected compared to intact reference conditions; habitat suitability was reduced for ≈85% of lichen, and ≈70% of moss species in both the Northern and Southern Operating Areas. There may be more decreaser species (species that decline in response to footprint) in these two groups because many of these species are most abundant in older forest, and are affected by activities that alter their preferred habitat.
- For vascular plants and birds, deviation from intact reference conditions was also due to a number of “strong increaser” species; these species are predicted to be more abundant than expected compared to reference conditions. Many increaser species benefit from human footprint and are otherwise relatively uncommon in native vegetation.
- Most large mammals monitored by cameras are habitat generalists that use both native habitat and human footprint resulting in higher intactness.
- All groups except mammals had some “strong decreaser” species with disproportionately low intactness—the drop in intactness from 100% was greater than the percentage of human footprint in the region. Many of these species are associated with older deciduous and mixedwood forests.
- In both the Northern and Southern operating areas, intactness is higher than the percentage of remaining native habitat because some species in each taxonomic group are tolerant of footprint. Overall intactness drops about 6-7% for every 10% increase in footprint. Intactness can drop at a greater rate when the amount of footprint is low in a region, because footprint creates habitat for species that prefer disturbances and would be at very low abundances otherwise. The large percent increases produce very low intactness values for these species, which lowers overall intactness.
References
ABMI. 2017. ABMI Essentials: Intactness. Available at: https://abmi.ca/home/publications/451-500/496.
This report is in partnership with