Attributing Landbase Change: How Changes in the Landbase Affect Bird Species
In this section we evaluate how landbase changes (e.g. new forestry footprint, fire) from 2010-2018 in Norbord's operating areas are predicted to affect bird species.
In the Northern and Southern Operating Areas, the majority of bird species were predicted to increase as a result of landbase change.
Many birds are early seral species that prefer young forests and/or are associated with open habitat types; these species benefit from landbase changes resulting from forestry activities and fire disturbance. In contrast, species associated with old forests are predicted to show a net decrease as a result of landbase changes because their preferred forest habitat is altered.
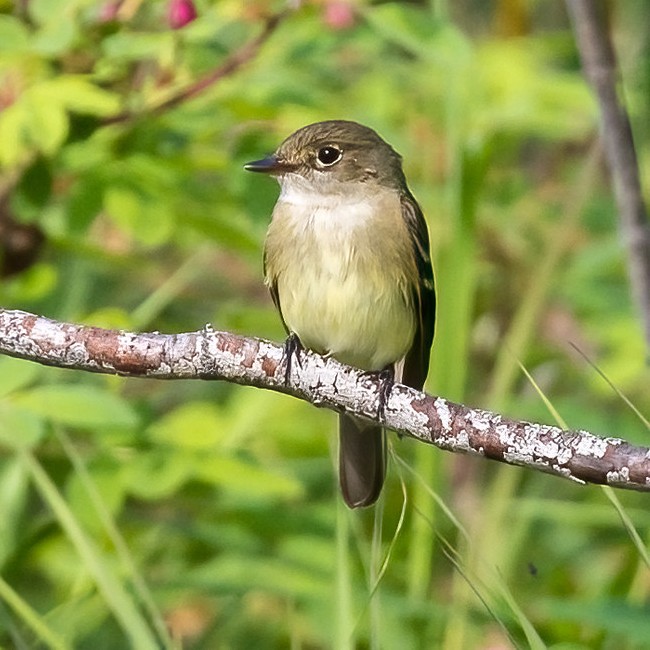 Photo credit: Tom Wilberding
Many species show a net increase from forestry activity, such as Alder Flycatcher.
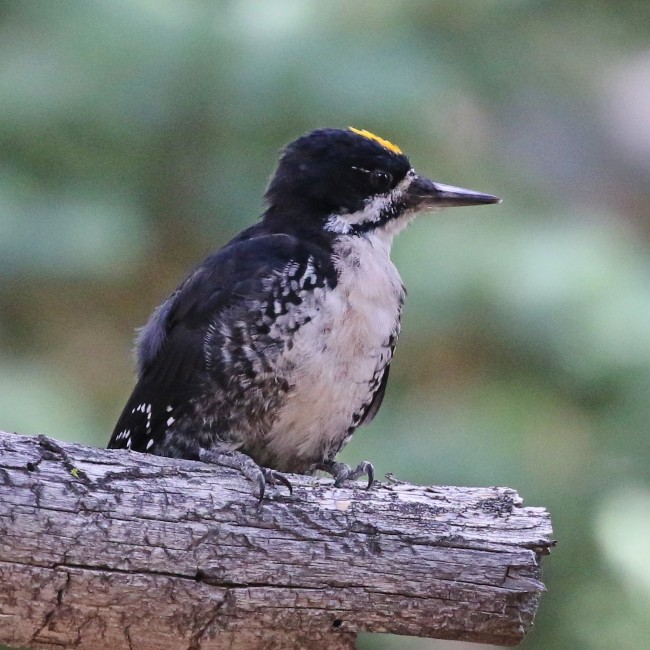 Photo credit: Tom Benson
Many species were predicted to increase due to natural disturbances like fire. Black-backed Woodpecker is one species that depends on young burned stands.
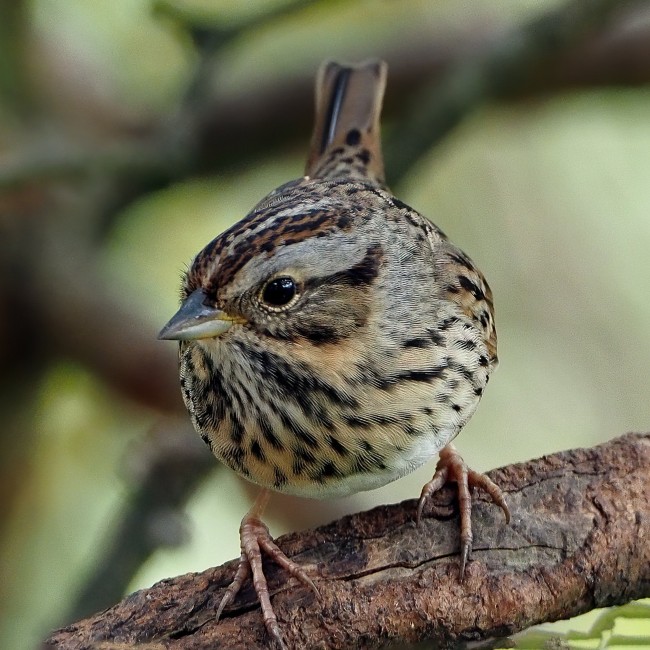 Photo credit: Doug Greenberg
Many species respond positively to habitat changes as a result of human footprint, such as Lincoln's Sparrow.
Introduction
In this section, we provide summaries of the overall predicted change in a species due to different types of change on the landbase, including changes as a result of forestry (new and old), non-forestry footprint (new and old), fire, and aging of undisturbed stands. In this section, we present roll-up figures for all bird species showing the effects of:
- New versus regenerating old forestry;
- Fires versus aging undisturbed stands;
- Net human footprint versus net natural changes.
Details for calculating attribution can be found in the Methods.
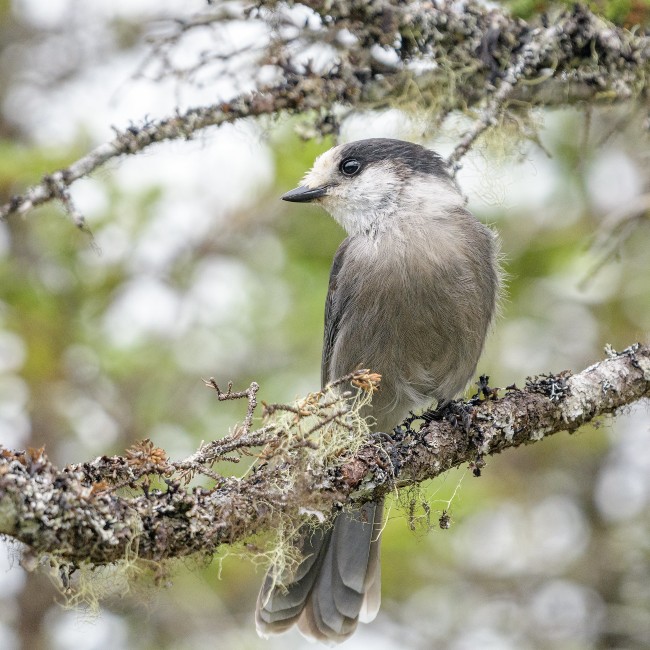
Canada Jay (Perisoreus canadensis)
Results
Effects of Landbase Change
To view how different types of landbase change affect bird species in Norbord's operating areas, click on a section to explore results.
- New Forestry vs Old Harvest Areas
- Fire vs. Aging of Undisturbed Natural Stands
- Human Footprint vs. Natural Change
New Forestry versus Regeneration of Old Harvest Areas
Highlights
- Many species show a net increase due to forestry. Most are early seral-species that benefit from new harvest areas more than they are reduced in aging older areas (above green line on left side of graphs). This is a common response by many bird species in both the Northern and Southern Operating Areas.
- Some species also benefit from aging of old harvest stands more than they are reduced in new forestry. These species also show a positive net effect from forestry (above green line on right side of graphs).
- Another group of species in both operating areas shows little change at all (near 0 on both axes). Most of these are generalists, or species not affected by forestry because they do not live in forests (e.g., wetland species, open habitat species).
- Old-forest species are a distinct group that show a net decrease, sometimes strongly, due to forestry (below green line). They are reduced by new forestry, while older harvest areas are not old enough to provide good habitat. They are most distinct in the Northern Operating Area. In the Southern Operating Area, some of the less specialized old forest species show some compensating increase in older regenerating harvest areas.
Fires versus Aging of Undisturbed Native Stands
Highlights
- Many species were predicted to increase due to natural changes. A few strongly benefit from recent fires while others show moderate increases (above green line on left side of graphs).
- Other species strongly associated with older forest also showed predicted net increases, because strong increases due to aging outweighed losses in burned areas (above green line on right side of graphs).
- Species that decreased (below green line) were generally associated with mid-seral forests, so they did not benefit from fires, and they had reduced habitat quality as the large cohort of early-mature forest became less suitable older forest.
Considered a burn specialist, the highest densities of the Black-backed Woodpecker are often recorded in young burned stands where it forages on wood-boring insects
Net Effect of Human Footprint versus Net Natural Change
Highlights
- A slight majority of analyzed bird species benefit from natural and/or human-caused disturbance. These species are the increasers (above green line) in both the Northern and Southern Operating Areas, where disturbances tended to outweigh aging of harvested areas and natural stands.
- In the Southern Operating Area, most large changes were associated with changes in human footprint (species on far left and far right of the graph), which is mainly forestry.
- The Northern Operating Area showed a more equal mix, with fires offsetting natural change for many species.
This report is in partnership with