Linear Footprint
In this section we summarize the density of linear features in Norbord's operating areas, overall and by different linear feature types.
The density of linear footprint, circa 2018, was:
 Northern Operating Area: 3.23 km/km2
 Southern Operating Area: 3.43 km/km2
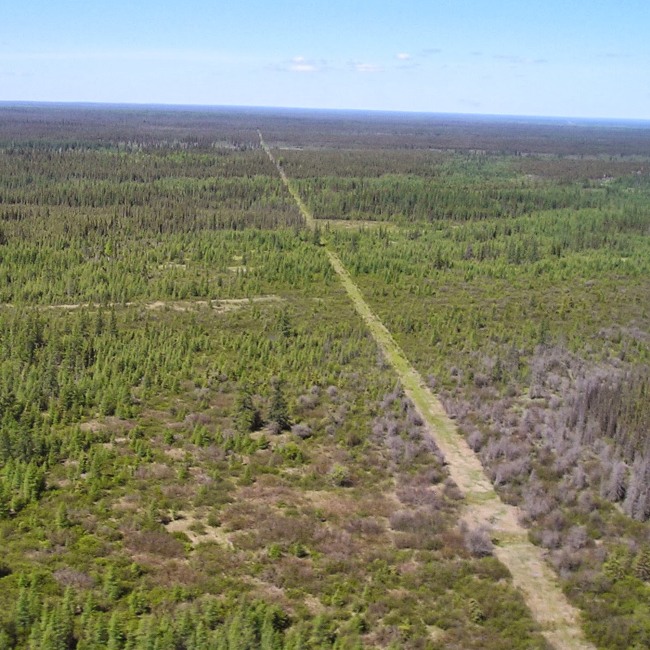 Photo: ABMI
Seismic lines
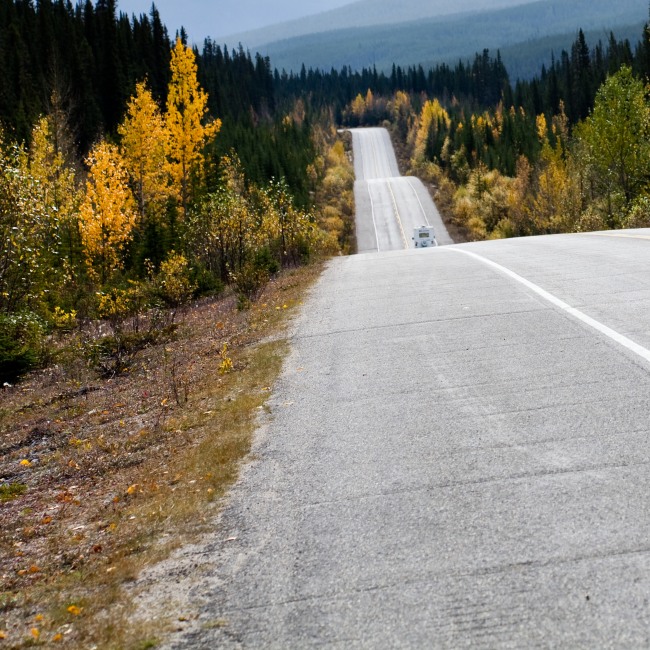 Photo: ABMI
Roads
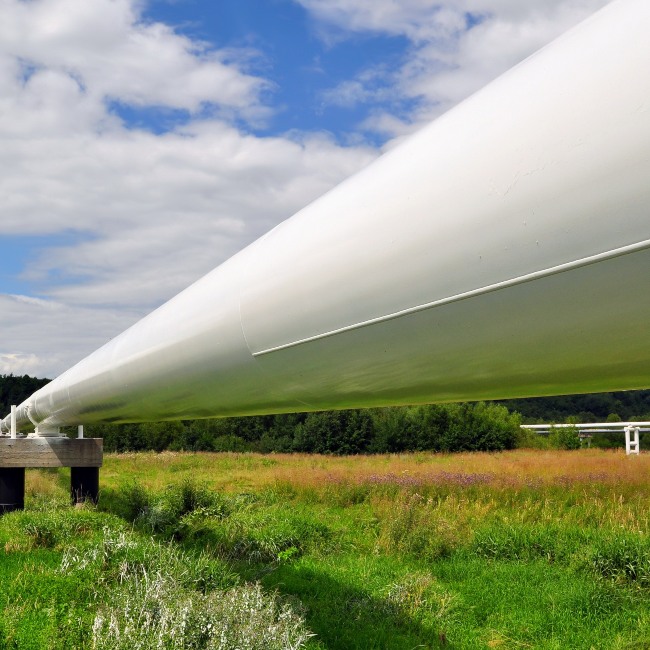 Photo: ABMI
Pipelines
Introduction
Linear footprint (e.g. seismic lines, pipelines, and roads), while occupying a small percentage area of the landbase, can have disproportionate impacts on biodiversity relative to its size[1]. Impacts on different components of biodiversity vary by line type, width of line, as well as line density, and differ among species with some "winners" and some "losers"[2]. For example, linear features can:
- increase movement rates by large predators such as wolves[3];
- improve habitat suitability for some species and decrease suitability for others[4];
- facilitate dispersal of vascular plants, including non-native species[4];
- facilitate range expansion of some species like White-tailed Deer[5];
- alter community composition (e.g., soil mites)[6].
Understanding the distribution of linear features, including line type, is important to supporting cumulative effects management in Norbord’s operating areas. Details for calculating linear footprint can be found in the Methods.
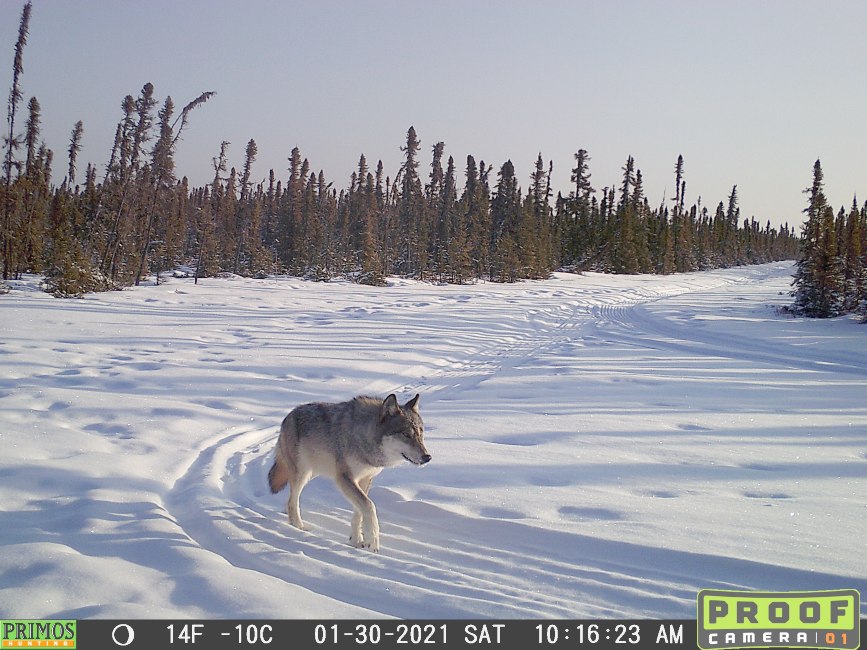 Photo: John Trapper
Wolves use seismic lines to move through the landscape.
Results
Density of Linear Features
Total linear footprint density, circa 2018, was found to be:
Northern Operating Area
![]()
3.23 km/km2
Southern Operating Area
![]()
3.43 km/km2
Partner Operating Area
![]()
3.06 km/km2
2018 Highlights
- Conventional seismic lines were the predominant line type in the Northern Operating Area representing 89% of line types in the region with a density of 2.84 km/km2. The remaining line types all had low densities in the region.
- In the Southern Operating Area, conventional seismic lines, at 1.98 km/km2, were also the most common linear features representing 58.0% of line types. However, pipelines, at 0.77 km/km2, and roads (both major and minor), at 0.62 km/km2, were also common, representing 22% and 18% of linear features, respectively.
- Transmission lines and railway lines had very low densities in all three operating areas.
References
Brook. B.W., N.S. Sodhi, and C.J.A. Bradshaw. 2008. Synergies among extinction drivers under global change. Trends in Ecology and Evolution 23(8):453-460.
Fisher, J.T. and A.C. Burton. 2018. Wildlife winners and losers in an oil sands landscape. Frontiers in Ecology and the Environment 16(6):323-328. doi:10.1002/fee.1807
Dickie, M., R. Serrouya, R.S. McNay, and S. Boutin. 2017. Faster and farther: wolf movement on linear features and implications for hunting behaviour. Journal of Applied Ecology 54(1):253-263.
Bayne, E., H. Lankau, and J. Tigner. 2011. Ecologically-based criteria to assess the impact and recovery of seismic lines: The importance of width, regeneration, and seismic density. Report No. 192. Edmonton, AB. 98 p.
Dawe, K.L., E.M. Bayne, and S. Boutin. 2014. Influence of climate and human land use on the distribution of white-tailed deer (Odocoileus virginianus) in the western boreal forest. Canadian Journal of Zoology 92(4):353-363.
Meehan, M.L., Z. Son, L.M. Lumley, T.P. Cobb, and H. Proctor. 2019. Soil mites as bioindicators of disturbance in the boreal forest in northern Alberta, Canada: Testing taxonomic sufficiency at multiple taxonomic levels. Ecological Indicators 102(2019):349-365. doi.org/10.1016/j.ecolind.2019.02.043
This report is in partnership with