Human Footprint Status & Trend
In this section we summarize the status and trend of human footprint in Norbord's operating areas.
Total human footprint, circa 2018, was found to be:
 Northern Operating Area: 8.8%
 Southern Operating Area: 30.7%
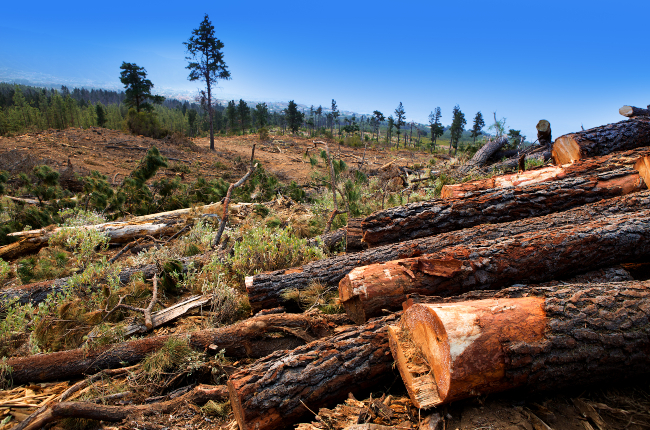
- Forestry was the largest human footprint for all operating areas.
- Effective human footprint was lower when recovery of forestry footprint is considered.

Introduction
The expansion of human footprint is one of the key threats to biodiversity[1]. Measuring human land uses—such as forest harvest areas, well pads, roads, and urban areas—is increasingly being used as a land use planning tool to monitor the status of landscapes[2].
In Norbord’s operating areas, habitat is being modified by humans primarily as a result of activities associated with the forestry and energy industry including the transportation infrastructure associated with these land-use activities. Responsible development of this region depends on understanding the complex interactions between these human activities, species, and habitats.
Human footprint data—including footprint type, amount, and trend—provide the context for interpreting observed changes in biodiversity over time. Details for calculating human footprint can be found in the Methods.
Results
Status of Human Footprint
Total human footprint, circa 2018, was found to be:
Northern Operating Area
![]()
8.8%
Southern Operating Area
![]()
30.7%
Partner Operating Area
![]()
18.4%
2018 Highlights
- Forestry was the largest human footprint for all assessed areas. Forestry footprint covered 25.2% of the Southern Operating Area, 15.3% of the Partner Operating Area, and 6.3% of the Northern Operating Area.
- After forestry, energy was the next most prevalent human footprint, covering 2.8% of the Southern Operating Area, and 1.9% of both the Northern and Partner Operating Area.
- Transportation was more common in the Southern (1.8%) and Partner (1.0%) Operating Areas compared to the Northern (0.4%) Operating Area.
- Agriculture, Urban/Industrial, and Human-created waterbodies covered very small areas (< 1.0%) in each Operating Area.
- Each footprint category has distinct effects on biodiversity, as detailed in the Sector Effects sections.
Results
Trend in Human Footprint
- Total human footprint increased in all three operating areas between 2000 and 2019; the largest increase was in the Southern Operating Area followed by the Partner and Northern Operating Areas.
- The amount of human footprint in the Southern Operating Area increased by 17.8 percentage points, from 13.6% to 31.4% between 2000 and 2019. This is compared to a 4.8 percentage point increase in the Northern Operating Area, from 4.2% to 9.0%.
- These increases were almost entirely driven by forestry footprint in all three operating areas; forestry footprint grew by 16.6 percentage points (9.3% to 25.9%) in the Southern Operating Area and by 3.5 percentage points (2.9% to 6.4%) in the Northern Operating Area.
- However, this increase in forestry footprint is lower when forest recovery is considered; forestry footprint increased by 12.4 percentage points (7.7% to 20.1%) in the Southern Operating Area and by 2.5 percentage points (2.2% to 4.8%) in the Northern Operating Area when the recovery of regenerating forests is included.
- Except for energy footprint in the Southern Operating Area, which increased by 1.2 percentage points (1.6% to 2.8%), all other footprint types showed small increases in each of the three Operating Areas (i.e., < 1.0 percentage points) between 2000 and 2019.
- The amount of human footprint was very low before 1980, after which time forestry footprint began to increase.
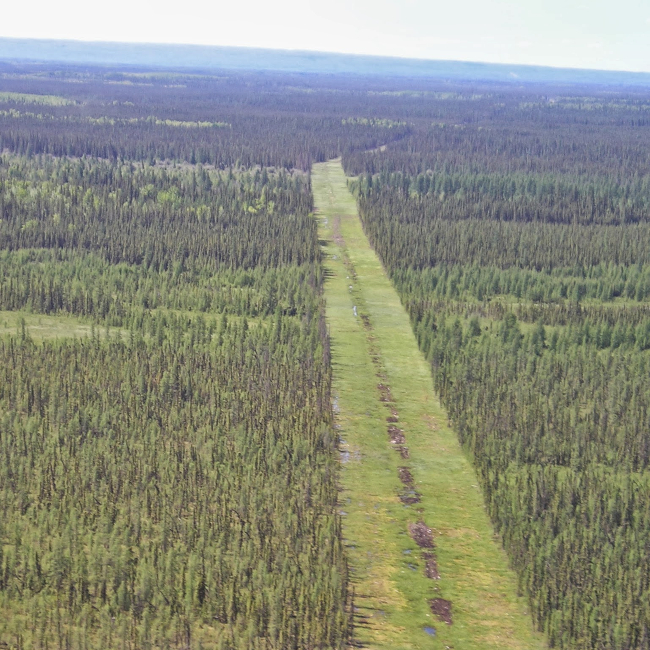
Pipeline from air
References
Sanderson, W.W. M. Jaiteh, M.A. Levy, K.H. Redford, A.V. Wannebo, and G. Wolmer. 2002. The human footprint and the last of the wild. Bioscience 52(10):891-904.
Haines, A.M., M. Leu, L.K. Svancara, J.M. Scott, and K.P. Reese. 2008. A theoretical approach to using human footprint data to assess landscape level conservation efforts. Conservation Letters 1:165-172.
This report is in partnership with