Status of Soil Mites
In this section we explore how human disturbance affects soil mites associated with old mixedwood and deciduous forests.
The overall intactness of old-forest soil mite species as measured by the Biodiversity Intactness Index was found to be, on average:
![]()
96.1%
Northern Operating Area
![]()
93.0%
Southern Operating Area
- This means most of the habitat in Norbord's operating areas is in good condition for soil mites.

Introduction
Soil mites (also known as oribatid or armoured mites) are the most numerically dominant microarthropods in forest systems[1] as well as being highly diverse, making them a critical component of Alberta’s soil biodiversity. The majority of soil mites live off the remains of plants, animals, and fungi. As a result, these tiny unseen species are vital to the maintenance of healthy soils. For example, soil mites:
- play a critical role in decomposition and the formation and maintenance of soil structure[2,3].
- provide ecosystem services including decomposition, soil formation, and pest control, which directly relate to food production, soil conservation, carbon sequestration, water and nutrient cycling, and pest and disease regulation.
- are valuable forest soil indicators because slow dispersal, low metabolic rates, low reproductive rates, and long life spans[4,5] make them sensitive to changes in the soil environment.
- have been shown to be significantly impacted by forest soil compaction and organic matter removal[6], and impacted at different levels by different forest harvesting practices[4,7,8].
Intactness and sector effects are summarized for soil mite species associated with old deciduous and mixedwood forests in Norbord’s operating areas. Details for calculating intactness and sector effects can be found in the Methods.
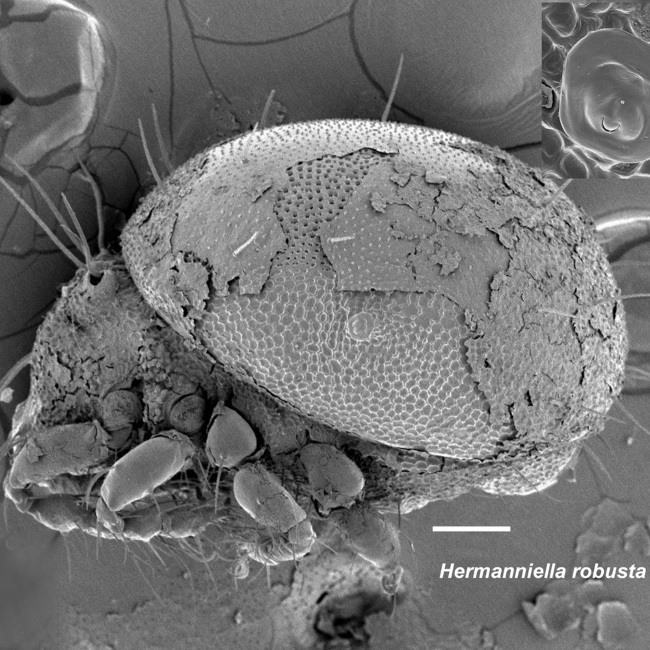 Photo: Dave Walter
Hermanniella robusta
Results
Biodiversity Intactness
The overall intactness of old-forest soil mite species as measured by the Biodiversity Intactness Index was found to be, on average:
Northern Operating Area
![]()
96.1%
21 species
Southern Operating Area
![]()
93.0%
21 species
Partner Operating Area
![]()
95.1%
19 species
2018 Highlights
- Habitat suitability for soil mite species, as indicated by intactness, is similar in all three operating areas but lowest in the Southern Operating Area.
- Of the 21 mite species detected in the Northern Operating Area, 16 species were within 5.0% of intact reference conditions, with the remaining 5 species within 11.0% of intact reference conditions.
- In the Southern Operating Area, 10 species were within 5.0% of intact reference conditions, with the remaining 11 species having intactness values between 80.0% and 94.7% intact.
- Species such as Gymnodamaeus ornatus, Quatrobelba montana, and Oribatella jacoti showed the largest negative deviations from intact reference conditions in both operating areas. These species are dependent on the soil conditions found in the old/mature forests.
- Forestry footprint also increases habitat suitability for some old-forest soil mite species that are also associated with open, grass, and/or wetland habitats. These species benefit from the removal of the forest canopy in harvested areas.
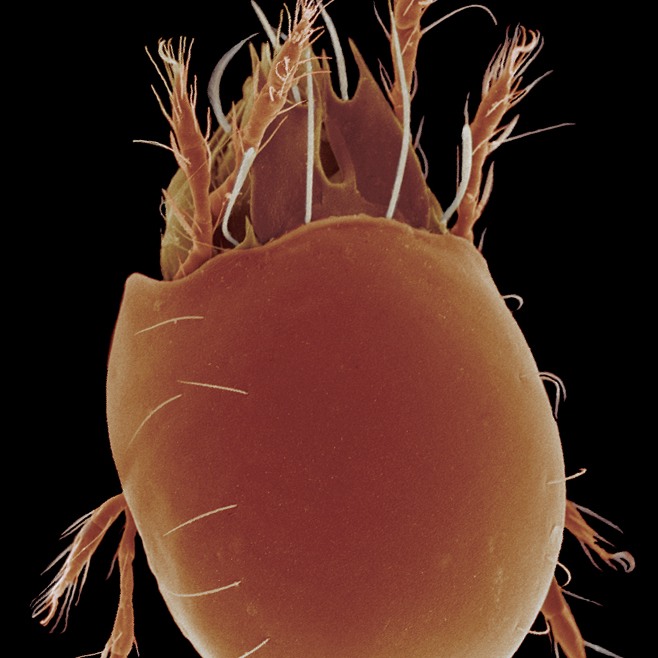
Oribatella jacoti
Results
Sector Effects
Local Scale Sector Effects
Local scale sector effects are used to understand what industrial sectors are most affecting the abundance of soil mites associated with old deciduous/mixedwood forests in Norbord’s operating areas. Changes in species' relative abundance are predicted within each sector’s footprint compared to the reference conditions with no human footprint.
- Except for forestry, all industrial sectors decrease habitat suitability compared to the habitat it replaces for most soil mite species associated with old deciduous and mixedwood forest in Norbord’s operating areas because these activities change and/or remove soil structure.
- Within forestry footprint, approximately 60% of soil mite species are predicted to be more abundant than expected compared to the habitat it replaces in both the Northern and Southern Operating Areas.
- Forestry footprint has smaller negative effects because removing canopy cover can create soil conditions that benefit certain soil mite species that are associated with old forests, but that are also associated with recently harvested forests (e.g., Hermanniella robusta).
Regional Population Effects
Regional population effects reflect the total expected change for the population of each soil mite species across Norbord’s operating areas due to each sector’s footprint. This incorporates the area of the footprint, the native habitats in the region where the footprint occurs, and the species response to a particular footprint. The calculation also incorporates the entire landbase of each operating area, large tracts of which have no human footprint.
- Regional effects are much less than local scale footprint effects because a great deal of old-forest habitat has not been disturbed by human activities in the operating areas.
- For all industrial sectors except forestry, regional population effects on old-forest soil mites were small—ranging from -2.9% to +2.1%—in both operating areas.
- Forestry footprint resulted in a predicted average change in the regional population of old-forest soil mites by +1.3%, ranging from -16.8% to +15.2%, in the Southern Operating Area and by an average +0.1%, ranging from -9.4% to +7.2%, in the Northern Operating Area.
- Three species—Gymnodamaeus ornatus, Oribatella jacoti, and Quatrobelba montana—are predicted to decrease by more than 5.0% in both operating areas. These species are most abundant in old deciduous stands and have low abundance in other habitat types.
To view species-specific sector effects, use the drop-down menu to select a species of interest.
Northern Operating Area - Local Scale Sector Effects
Figure: Local Scale Sector Effects. Predicted per cent change in species' relative abundance inside areas that have been disturbed by each sector (human footprint type) compared to reference conditions with no human footprint. Local scale sector effects values less than 0% indicate fewer soil mites in that type of footprint than in the reference habitat; values greater than 0% indicate more soil mites.
Northern Operating Area - Regional Scale Sector Effects
Figure: Regional Sector Effects. Predicted per cent change in the total regional population of soil mites, by species, due to the footprints of each industrial sector. Regional sector effect values less than 0% indicate a predicted decrease in the regional population due to a sector's footprint and values greater than 0% indicate a predicted increase. Note that sector effects consider only the direct impact of disturbed areas and do not consider edge effects or other non-footprint effects (e.g., noise, pollution).
Southern Operating Area - Local Scale Sector Effects
Figure: Local Scale Sector Effects. Predicted per cent change in species' relative abundance inside areas that have been disturbed by each sector (human footprint type) compared to reference conditions with no human footprint. Local scale sector effects values less than 0% indicate fewer soil mites in that type of footprint than in the reference habitat; values greater than 0% indicate more soil mites.
Southern Operating Area - Regional Scale Sector Effects
Figure: Regional Sector Effects. Predicted per cent change in the total regional population of soil mites, by species, due to the footprints of each industrial sector. Regional sector effect values less than 0% indicate a predicted decrease in the regional population due to a sector's footprint and values greater than 0% indicate a predicted increase. Note that sector effects consider only the direct impact of disturbed areas and do not consider edge effects or other non-footprint effects (e.g., noise, pollution).
References
Wallwork, J.A. 1983. Oribatids in forest ecosystems. Annual Review of Entomology 28: 109–130.
Behan-Pelletier, V.M. 1999. Oribatid mite biodiversity in agroecosystems: role for bioindication. Agriculture, Ecosystems and Environment 74(1999):411-423.
McAdams, B.N., S.A. Quideau, M.J.B. Swallow, and L.M. Lumley. 2018. Oribatid mite recovery along a chronosequence of afforested boreal sites following oil sands mining. Forest Ecology and Management 422(2018):281-293.
Lindo, Z. and S. Visser. 2004. Forest floor microarthropod abundance and oribatid mite (Acari: Oribatida) composition following partial and clear-cut harvesting in the mixedwood boreal forest. Canadian Journal of Forest Research 34(5):998-1006. https://doi.org/10.1139/x03-284
Norton, R.A. 1990. Acarina: Oribatida. In Soil biology guide. Edited by D.L. Dindal. John Wiley & Sons, Inc., Toronto, Ont. pp. 779–803.
Bird, G.A., and Chatarpaul, L. 1986. Effect of whole-tree and conventional forest harvest on soil microarthropods. Canadian Journal of Zoology 64(1986): 1986–1993.
Battigelli, J.P., J.R. Spence, D.W. Langor, and S.M. Berch. 2004. Short-term impact of forest soil compaction and organic matter removal on soil mesofauna density and oribatid mite diversity. Canadian Journal of Forest Research 34:1136-1149.
Déchêne, A.D., and C.M. Buddle. 2009. Effects of experimental forest harvesting on oribatid mite biodiversity. Forest Ecology and Management 258(2009):1331-1341.
This report is in partnership with