Status of Mammals
In this section we explore how human disturbance effects mammals in Norbord's operating areas.
The overall intactness of 14 mammal species as measured by the Biodiversity Intactness Index was found to be, on average:
![]()
95.4%
Northern Operating Area
![]()
89.5%
Southern Operating Area
- This means most of the habitat for mammals is in good condition, but habitat suitability is lower in some areas due to human development activities.
- Habitat suitability is higher in the Northern Operating Area because there is less human footprint in this landbase compared to the Southern Operating Area.

Introduction
Mammals play many important roles in northern Alberta ecosystems, including top predators (e.g., Gray Wolf) and prey (e.g., White-tailed Deer), while others are socially and economically important. Recent human activities, like forestry and energy development, have varying effects on mammal populations[1]. For example:
- Some species, like the Coyote and White-tailed Deer, can benefit from some forms of human development because of the increased food availability associated with humans and open habitats.
- Other species become less common as human land-use intensifies[2]. For example, human activities that divide contiguous tracts of forest into smaller patches impact species that require large undisturbed areas, such as Wolverine. Grizzly Bear populations are lower in areas where road densities are more than 0.6 km/km2 [3]; mortality risk increases as human access increases.
- The removal of trees by human activities directly affects the availability of forested habitats that are important for many mammals including forest-dependent species, like Marten and Fisher, or species that use forests to meet seasonal needs (e.g., thermal cover in winter for Moose and Deer).
Intactness and sector effects are summarized for mammals monitored using wildlife cameras in Norbord's operating areas. Details for calculating intactness and sector effects can be found in the Methods.
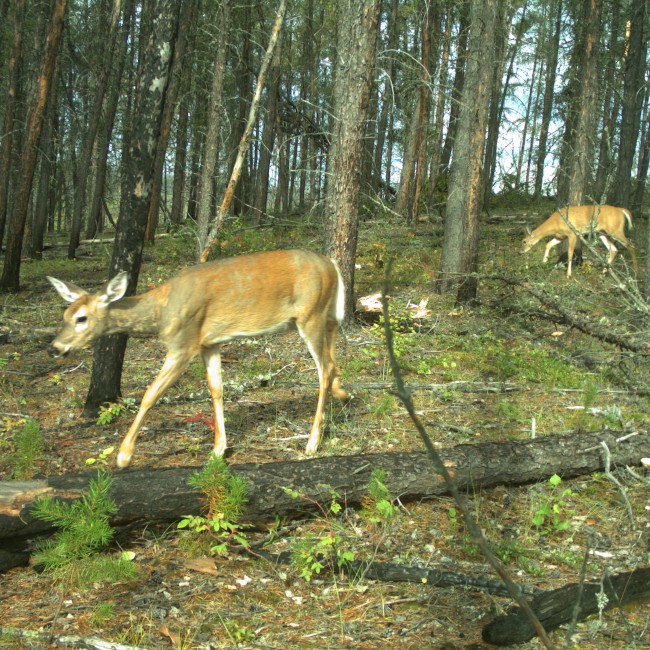 Photo: Wildtrax
White-tailed Deer (Odocoileus virginianus)
Results
Biodiversity Intactness
The overall intactness of 14 mammal species as measured by the Biodiversity Intactness Index was found to be, on average:
Northern Operating Area
![]()
95.4%
14 species
Southern Operating Area
![]()
89.5%
14 species
Partner Operating Area
![]()
93.1%
14 species
2018 Highlights
- Habitat suitability for mammal species, as indicated by intactness, is higher in the Northern Operating Area compared to in the Southern Operating Area; this can be attributed to the lesser total human footprint in the north.
- Deviation from intact reference conditions can mostly be attributed to decreases in habitat suitability for grassland species (e.g., Mule Deer and Elk), mature/old forest-dependent species (e.g., Marten), or species that prefer remote areas far from human development (e.g., Wolverine). Deviation from reference conditions is also due to increases in habitat suitability for species that are habitat generalists (e.g., Red Fox and Coyote).
- In the Northern Operating Area, intactness was close to reference conditions (< 10% change) for most mammal species, with intactness decreasing by more than 10% from reference conditions for Mule Deer (-11.6%) only. This is a southern grassland species that is not frequently found in the region.
- In the Southern Operating Area, intactness also decreased by > 10% from reference conditions for Wolverine, Marten, and Cougar because human development impacts their preferred habitat including old/mature forests or intact, remote areas.
- In both operating areas, intactness increased from reference conditions the most for Canada Lynx, which greatly benefits from forestry footprint, and Red Fox, a habitat generalist that benefits from all human development.
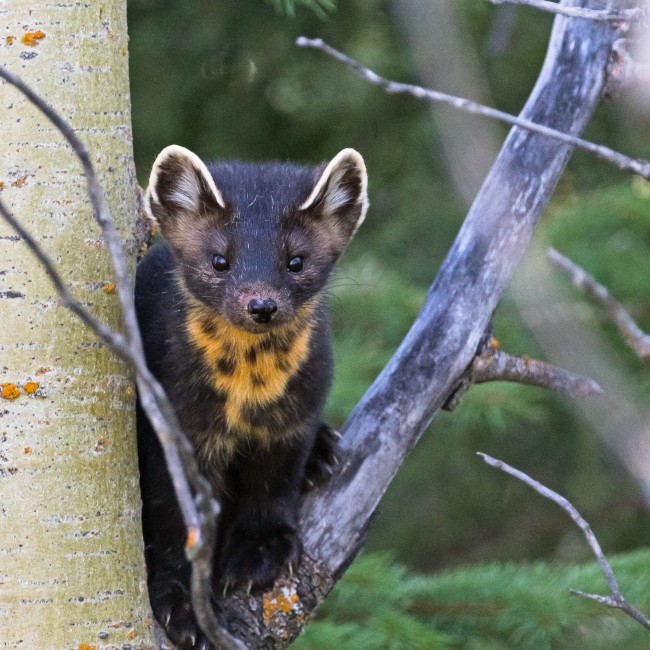
Marten (Martes americana)
Results
Sector Effects
Local Scale Sector Effects
Local scale sector effects are used to understand what industrial sectors are most affecting the abundance of mammal species in Norbord’s operating areas. Changes in species' relative abundance are predicted within each sector’s footprint compared to the reference conditions with no human footprint.
- The footprints of all sectors decrease habitat suitability for most mammal species associated with forests, such as Marten and Fisher, because these activities impact their preferred habitat.
- Some species benefit from footprint created by industrial sectors. Habitat generalists, such as Coyote and Red Fox, are predicted to be more abundant than expected within most footprint types compared to reference conditions, especially energy and urban/industrial footprint.
- The largest shifts in habitat suitability as a result of the forestry sector in both operating areas were increased habitat suitability for Canada Lynx and Red Fox, and decreased habitat suitability for Mule Deer and Wolverine.
Regional Population Effects
Regional population effects reflect the total expected change for the population of each mammal species across Norbord’s operating areas due to each sector’s footprint. This incorporates the area of the footprint, the native habitats in the region where the footprint occurs, and the species response to a particular footprint. The calculation also incorporates the entire landbase of each operating area, large tracts of which have no human footprint.
- Regional effects are smaller than local scale sector effects because there are still large amounts of undisturbed vegetation in the operating areas; regional effects are larger in the south because of the higher footprint there.
- Regional population effects of energy, transportation, and urban/industrial footprint on mammals were small—ranging from -2.4% to +6.0% in the Northern and Southern Operating Areas.
- Forestry footprint was predicted to create the largest changes in the regional population of Mule Deer, Wolverine, Marten, and Cougar in both operating areas. Except for Mule Deer, these species are generally associated with mature/old forests or intact habitat far from human activities. Mule Deer are a grassland-associated species and are not frequently found in young forest habitat.
- Forestry footprint was predicted to strongly increase (> 15%) the regional populations of Canada Lynx and Red Fox in the Southern Operating Area, with smaller effects in the Northern Operating Area.
To view species-specific sector effects, use the drop-down menu to select a species of interest.
Northern Operating Area - Local Scale Sector Effects
Figure: Local Scale Sector Effects. Predicted per cent change in species' relative abundance inside areas that have been disturbed by each sector (human footprint type) compared to reference conditions with no human footprint. Local scale sector effects values less than 0% indicate fewer mammals in that type of footprint than in the reference habitat; those greater than 0% indicate more mammals.
Northern Operating Area - Regional Scale Sector Effects
Figure: Regional Sector Effects. Predicted per cent change in the total regional population of mammal species due to the footprints of each industrial sector. Regional sector effect values less than 0% indicate a predicted decrease in the regional population due to a sector's footprint and values greater than 0% indicate a predicted increase. Note that sector effects consider only the direct impact of disturbed areas and do not consider edge effects or other non-footprint effects (e.g., noise, pollution).
Southern Operating Area - Local Scale Sector Effects
Figure: Local Scale Sector Effects. Predicted per cent change in species' relative abundance inside areas that have been disturbed by each sector (human footprint type) compared to reference conditions with no human footprint. Local scale sector effects values less than 0% indicate fewer mammals in that type of footprint than in the reference habitat; those greater than 0% indicate more mammals.
Southern Operating Area - Regional Scale Sector Effects
Figure: Regional Sector Effects. Predicted per cent change in the total regional population of mammal species due to the footprints of each industrial sector. Regional sector effect values less than 0% indicate a predicted decrease in the regional population due to a sector's footprint and values greater than 0% indicate a predicted increase. Note that sector effects consider only the direct impact of disturbed areas and do not consider edge effects or other non-footprint effects (e.g., noise, pollution).
References
Toews, M., F. Juanes. and A.C. Burton. 2018. Mammal responses to the human footprint vary across species and stressor. Journal of Environmental Management 217:690-699. doi.org/10.1016/j.jenvman.2018.04.009.
Fisher, J.T. and A.C. Burton. 2018. Wildlife winners and losers in an oil sands landscape. Frontiers in Ecology and the Environment 16(6):323-328. doi:10.1002/fee.1807
Alberta Environment and Parks. 2020. Alberta Grizzly Bear Recovery Plan. Alberta Species at Risk Recovery Plan No. 37. Edmonton, AB. 84 pp.
This report is in partnership with