Research Spotlight: Moose
The average density of Moose in the Southern Operating Area was:
0.71 individuals/km2
Norbord's Southern Operating Area is predicted to provide highly suitable habitat for Moose. Habitat suitability is lower in the Northern Operating Area.
Moose populations benefit from the increased quantity of young browse created by forestry activities in the Southern Operating Area.
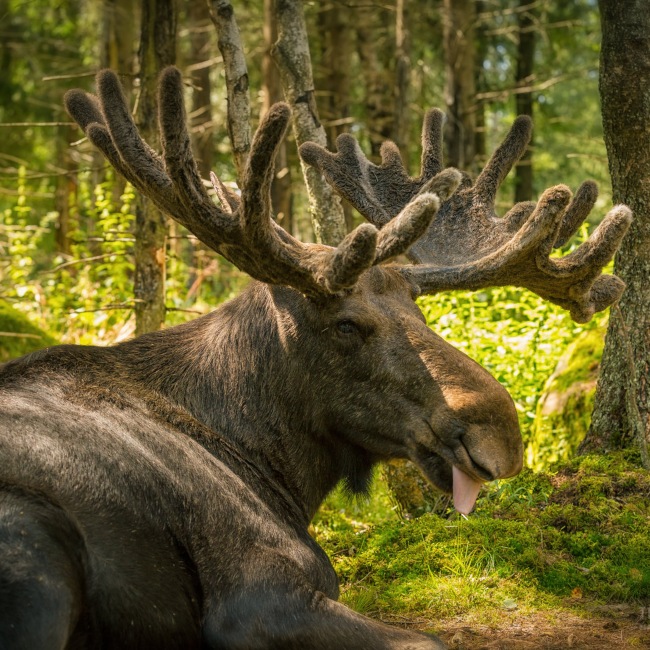 Photo: Thomas Haeusler
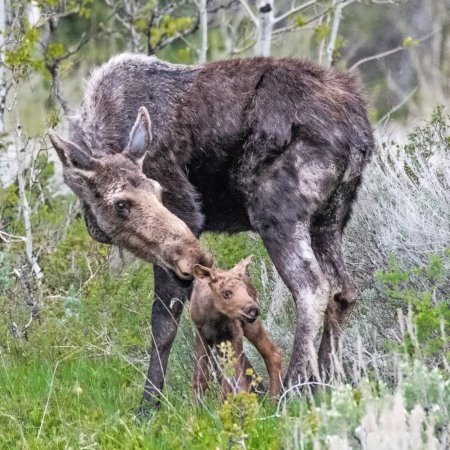 Photo: Rich Miller
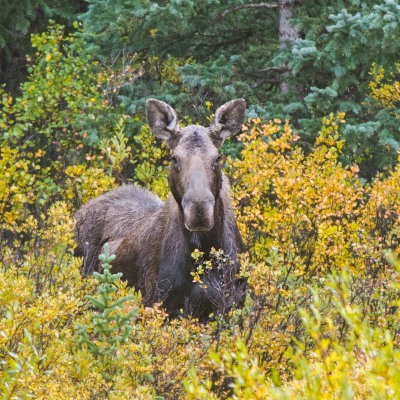 Photo: Adam Meek
Introduction
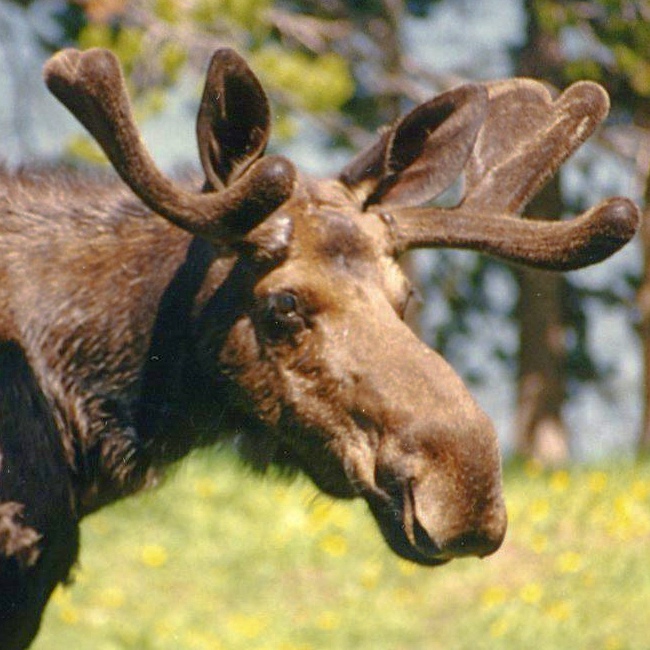
Moose (Alces alces) are a large wetland-associated species found in all of the Natural Regions in Alberta.
Moose are particularly well-adapted to life in the boreal forest, as they:
- are generalist browsers of woody deciduous shrubs;
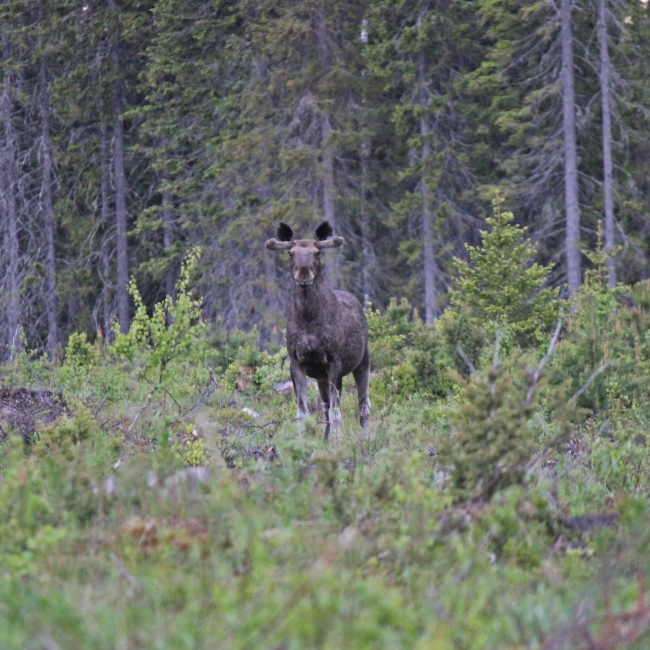
- use a wide variety of open habitats in the summer for foraging, such as fire burns, harvested areas, and shrublands;
- take advantage of mature forests with good snow interception as areas for bedding that provide both thermal and security cover;
- are adaptable, allowing them to take advantage of opportunities that landscape disturbance sometimes presents, such as increased food in young forests.
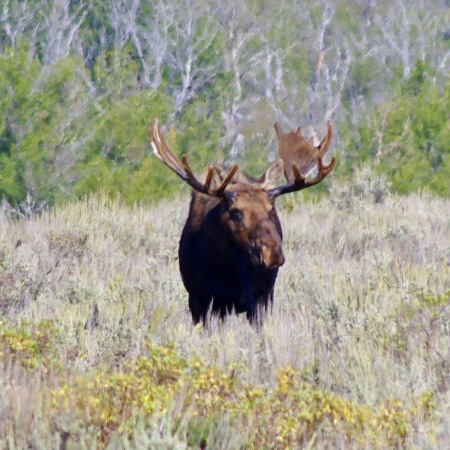
However, Moose are sensitive to some types of human footprint—such as roads, industrial facilities, and cutlines—because of increased vulnerability to predators (both animal and human). Moose generally exhibit avoidance and/or low use of these features.
Wetlands, lake margins, and other riparian zones are important habitat for Moose, as they forage for salt-rich, submerged vegetation.
Moose Population
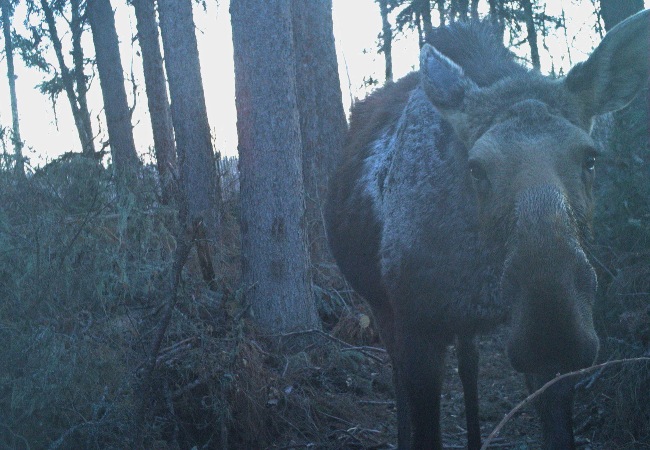 Photo: Wildtrax
Camera trap photo of Moose
Between 2017 and 2019, Moose were detected at 27 of 59 (46%) ABMI camera locations within Norbord's Southern Operating Area and Partner Operating Area.
- Data collected from wildlife cameras can be used to estimate the density of medium to large mammal species, including Moose.
- The average density of Moose is 0.71 individuals per km2, with a 90% confidence interval of 0.54 to 0.88 individuals per km2. This is higher than Moose densities reported elsewhere in the boreal region where density estimates are closer to 0.4 individuals per km2.
- Density estimated from wildlife camera data tend to overestimate true density, so these results should be interpreted as a relative measure rather than an absolute value. Relative density is still useful as a means to compare areas over time.
- The ABMI plans to deploy wildlife cameras in the Northern Operating Area in 2021.
Species-habitat Associations
Moose use a variety of forest types, vegetation types, as well as different categories of human footprint as indicated by their habitat associations.
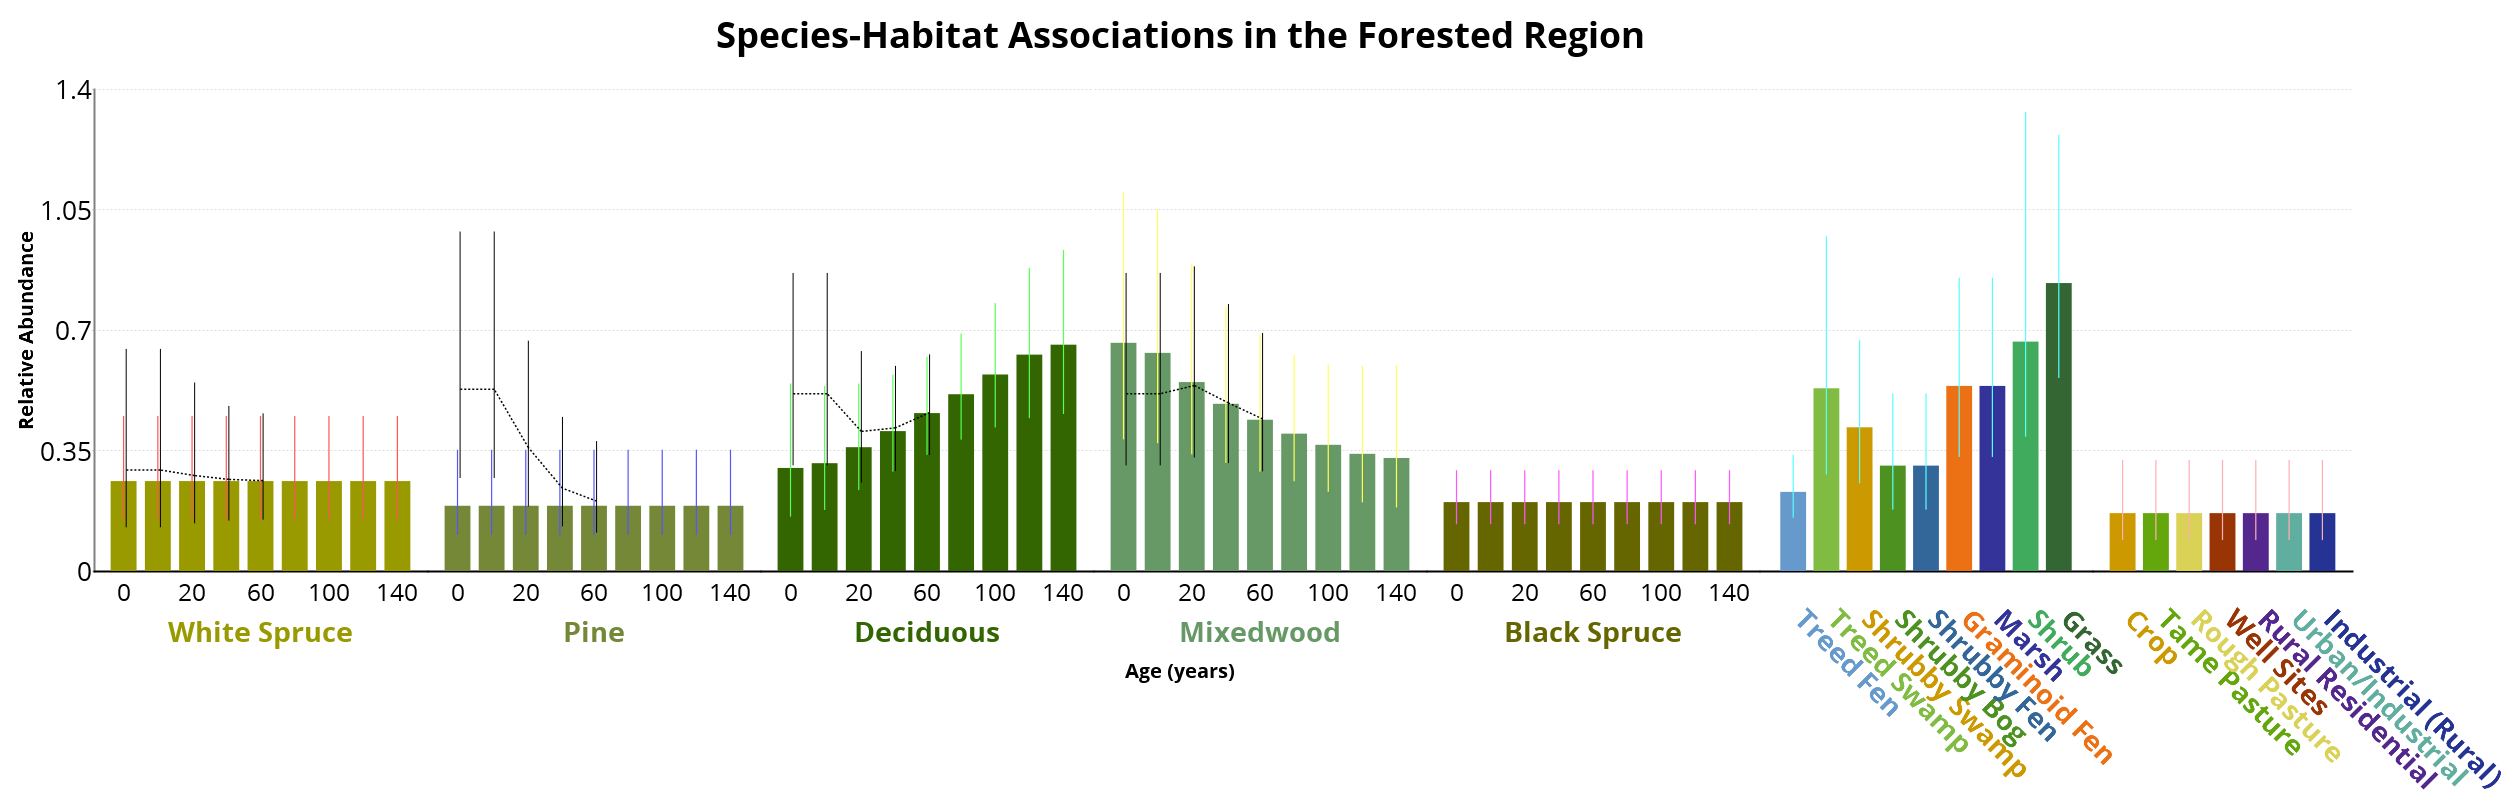
- Moose relative abundance is highest in open habitat types such as grass and shrub vegetation types, as well as young mixedwood stands originating from natural disturbance and mature/old deciduous forests.
- Moose relative abundance is also high in wetland habitats such as marsh, graminoid fen, and treed swamps.
- More information on Moose habitat associations can be found here.
Predicted Relative Abundance
Most of the landscape in Norbord's Southern Operating Area is predicted to provide highly suitable habitat for Moose. Habitat suitability is lower in the Northern Operating Area.
- The intactness of Moose was 95.1% in the Southern Operating Area, reflecting the cumulative effect of human footprint on this species. This species is predicted to be more abundant than expected compared to reference conditions in this landbase. Higher habitat suitability is likely due in part to forestry activities which increase the amount of the young forest and shrub habitat preferred by Moose.
- In the Northern Operating Area, Moose intactness was 99.1% with this species predicted to be slightly less abundant than expected compared to reference conditions. Habitat suitability is generally predicted to be lower in the Northern Operating Area compared to in the south.
Moose (Alces alces)
Effects of Forestry Footprint
Predicted Effects of Forestry Footprint on Moose
The ABMI combines its species habitat models with landbase information to infer the effects of different industrial sectors on Moose at two scales. Local scale effects indicate how much the abundance of Moose changes in the exact areas where forestry footprint occurs. Regional population effects show how much the total population of Moose in the region is predicted to have changed due to that sector’s footprint in the region. Details for calculating sector effects can be found in the Methods.
Local Scale Effects
Moose are predicted to be more abundant where forestry footprint occurs, increasing by:
 Northern Operating Area: +3.7%
 Southern Operating Area: +37.4%
Moose are positively impacted by the increase in young, shrubby browse created by forestry activities.
Regional Population Effects
Moose populations are predicted to be more abundant across each operating area because of forestry footprint, increasing by:
Northern Operating Area: +0.3%
Southern Operating Area: +8.3%
Larger Moose populations can result when food is more abundant.
This report is in partnership with