Interior Native Habitat
In this section we summarize the amount of interior native habitat in Norbord's operating areas at different distances from human footprint.
The status of interior native habitat, circa 2018, was:
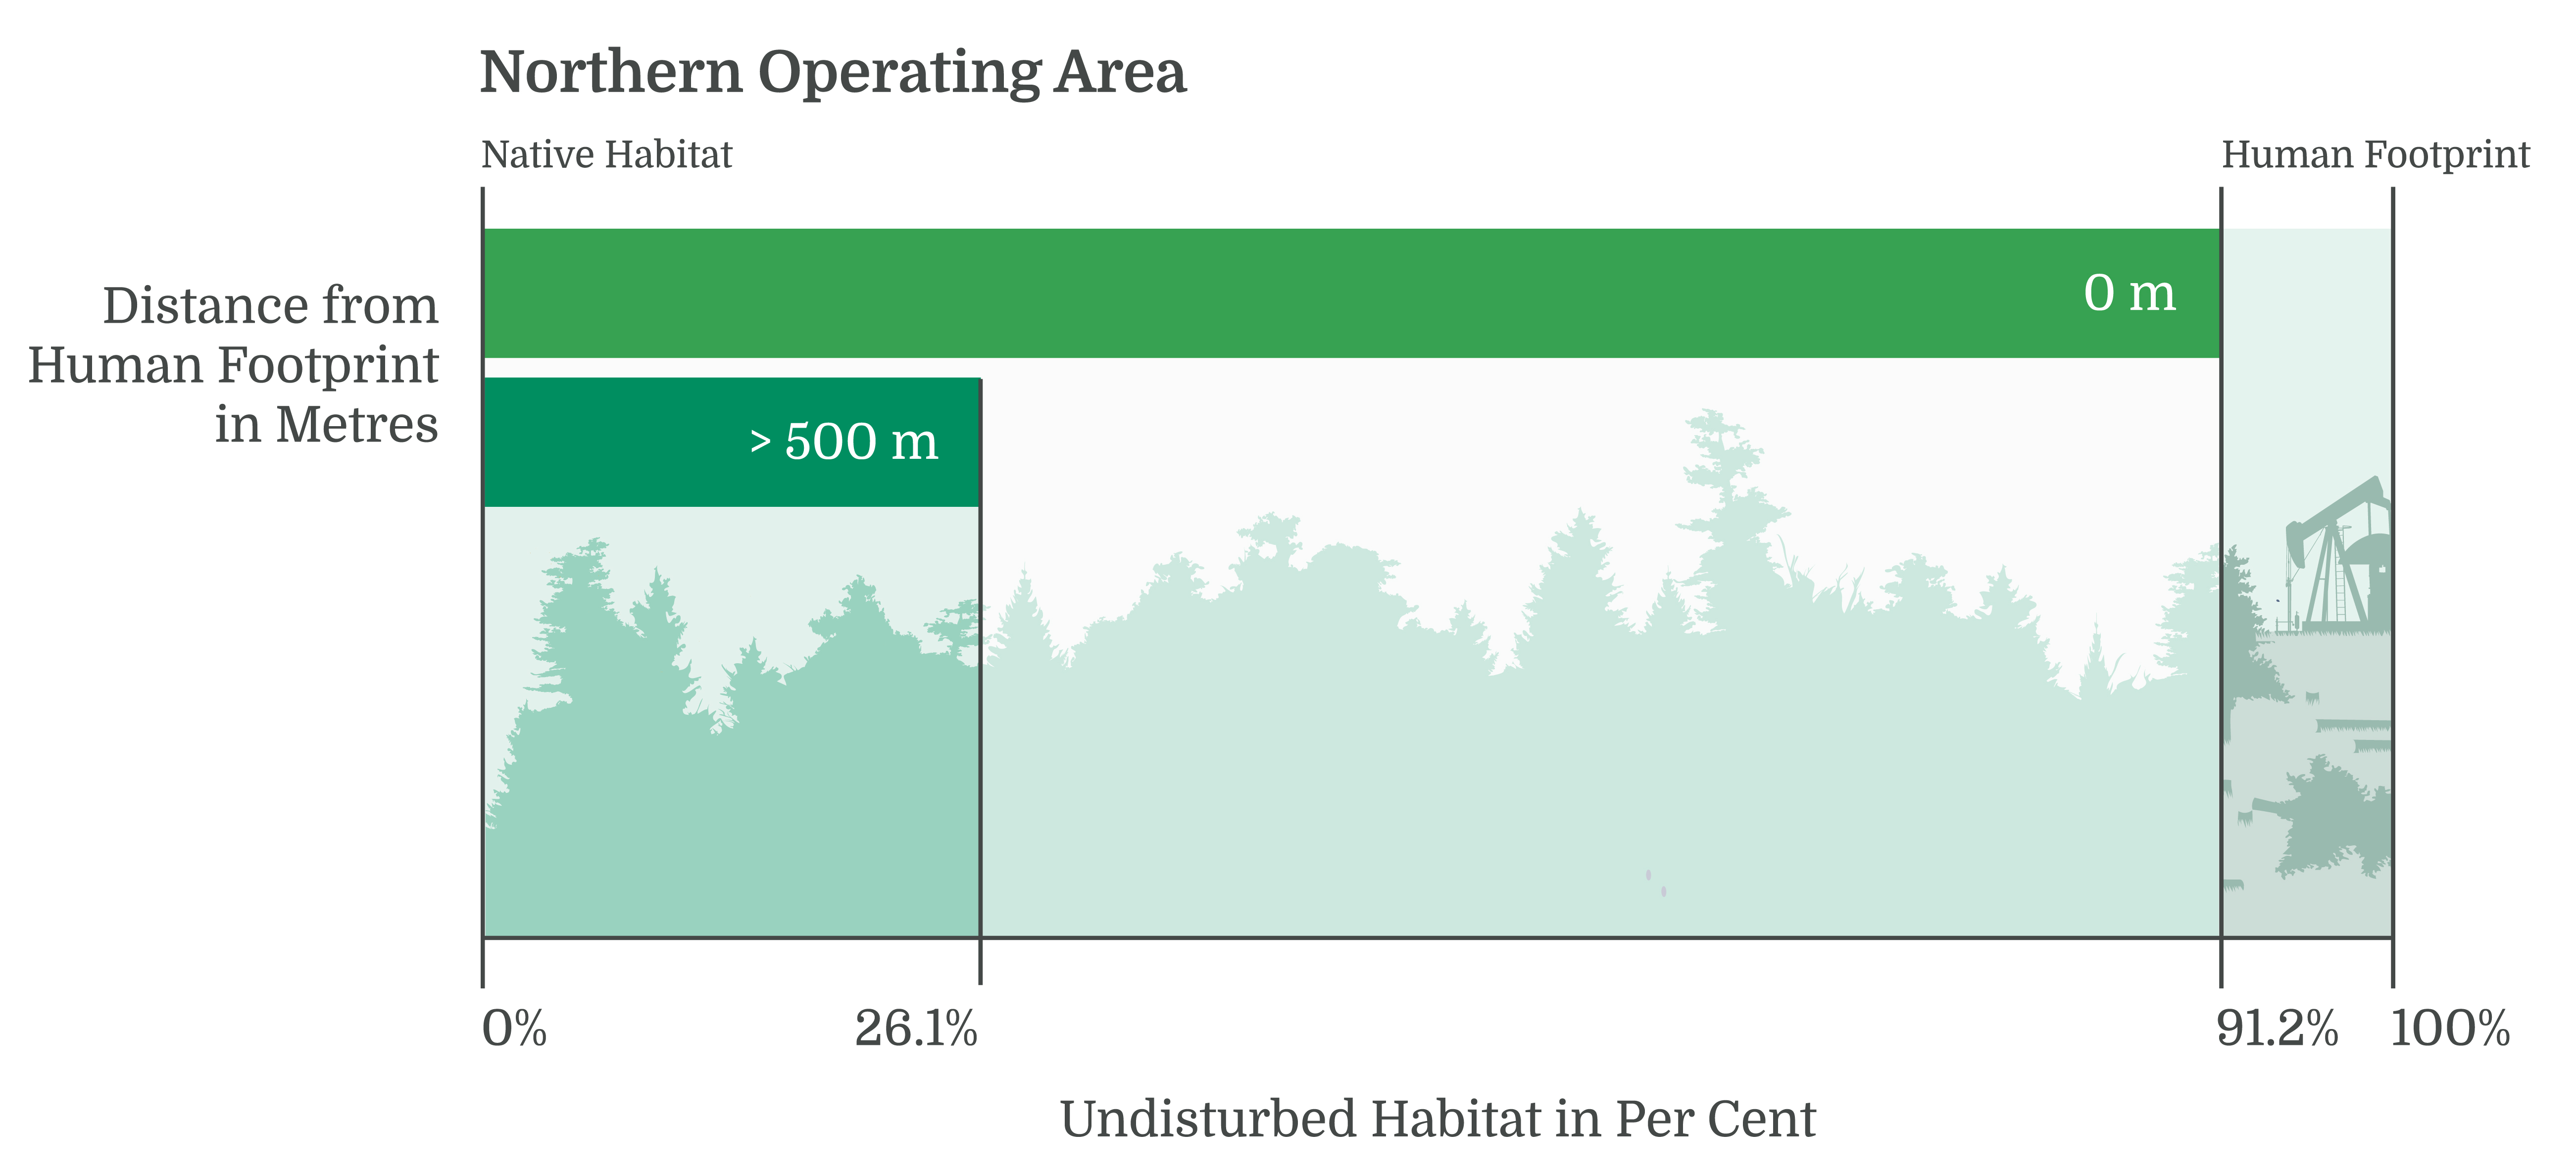
 Northern Operating Area: 91.2%
 Southern Operating Area: 69.4%
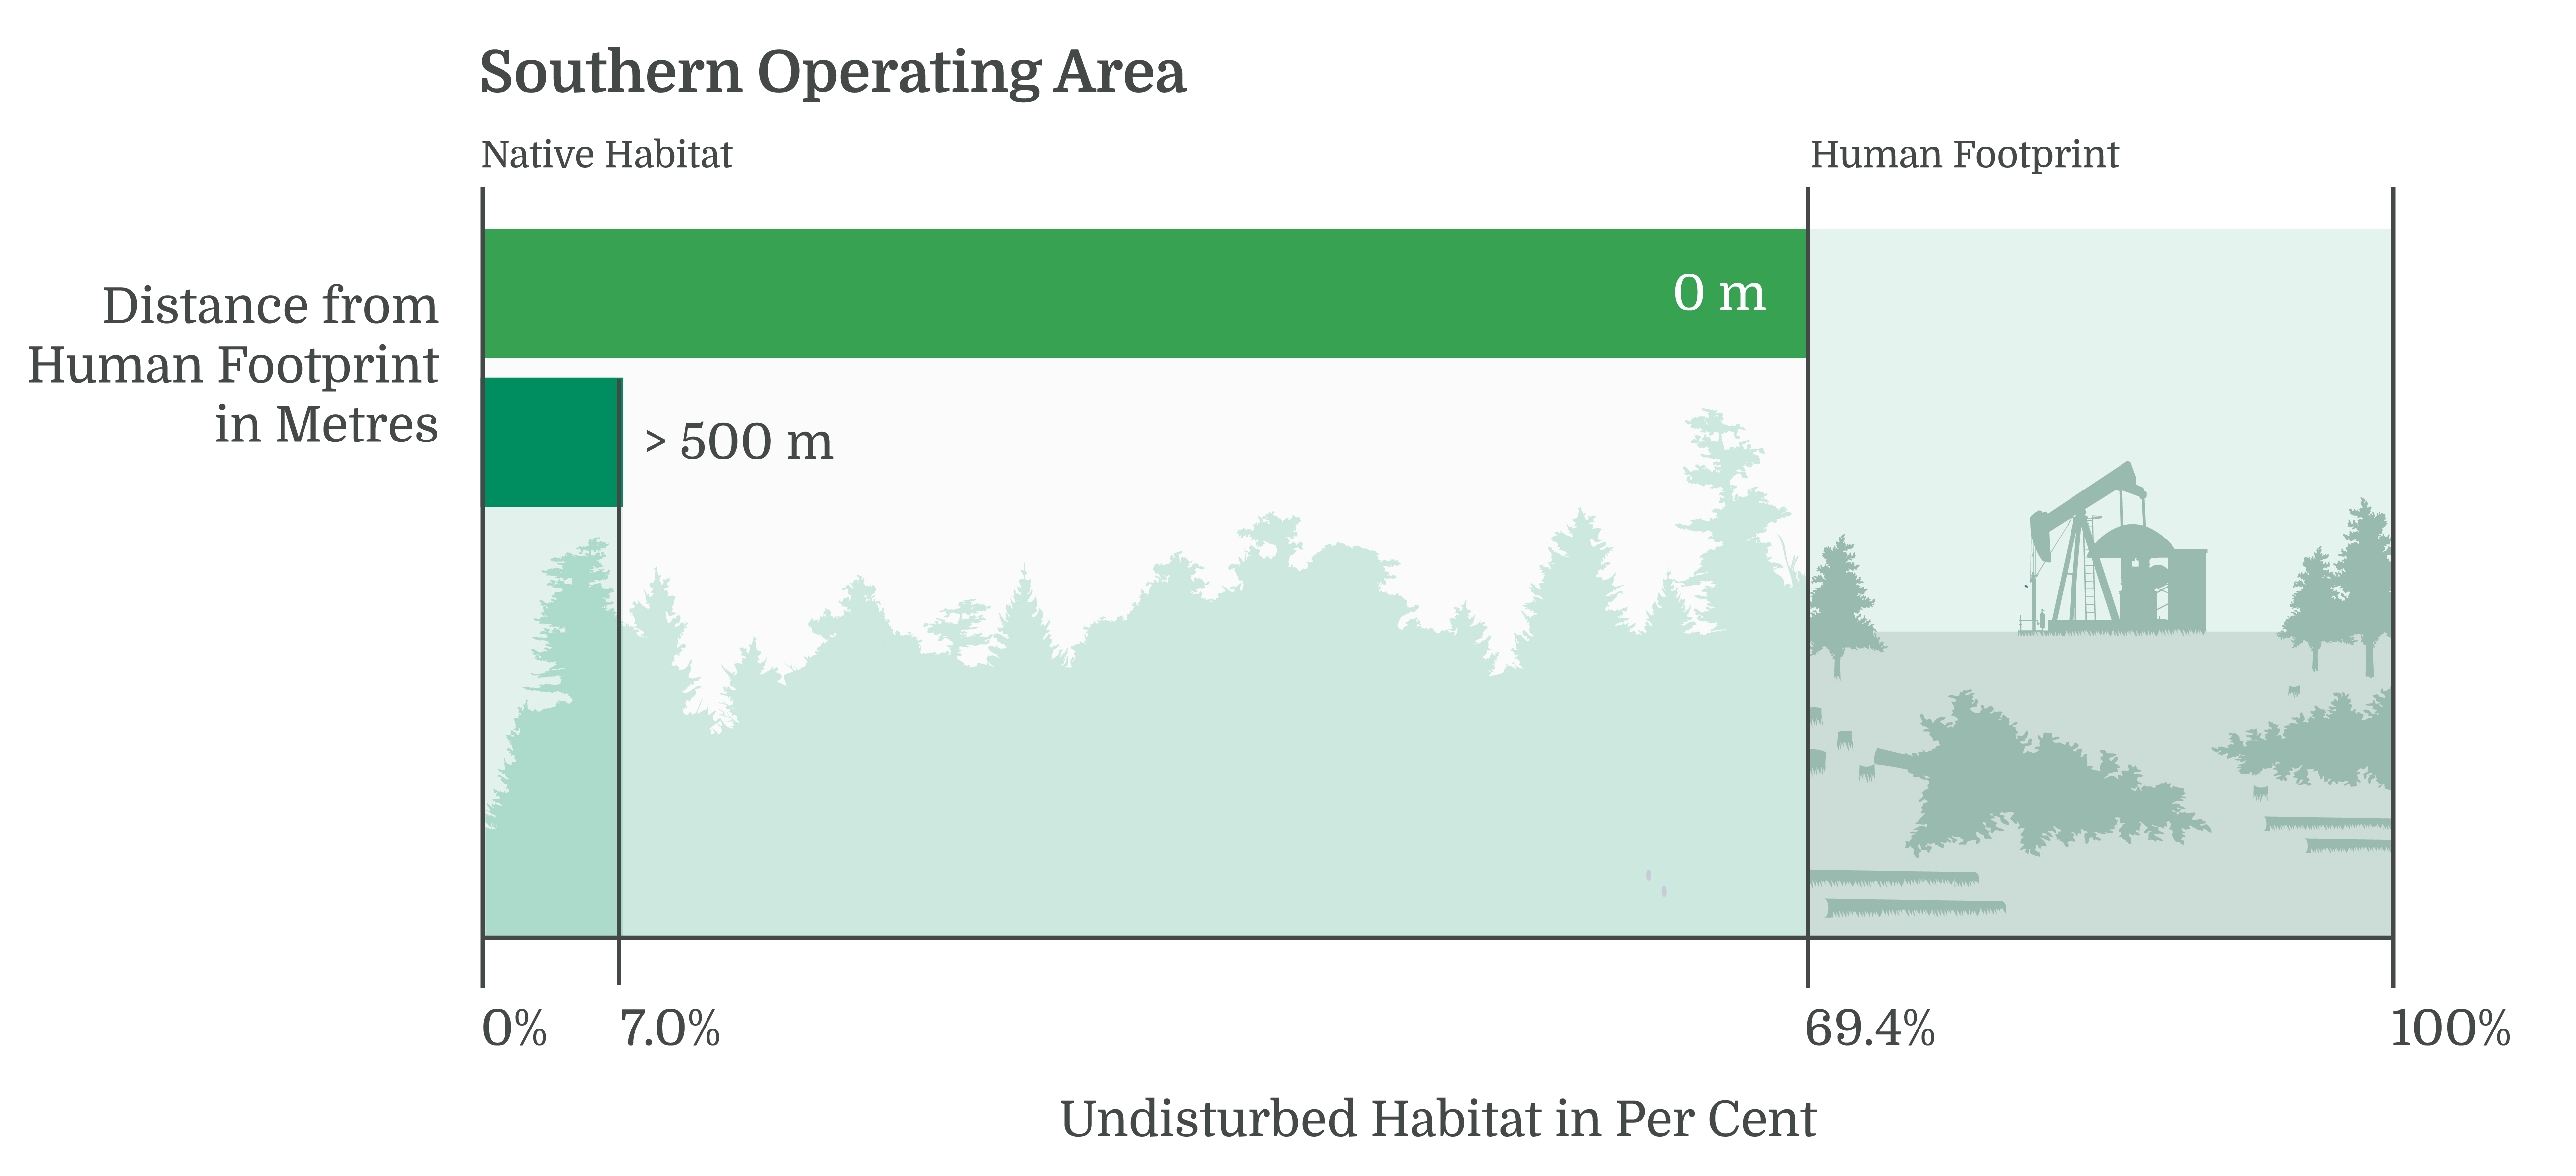
Edge effects due to linear features (e.g. seismic lines, pipelines, and roads) can substantially reduce habitat for species that prefer areas further away from human footprint.
Introduction
Habitat loss due to human disturbance is a primary threat to biological diversity. In addition to the direct loss of native habitat, the proximity of human footprint can indirectly impact biodiversity in nearby native vegetation. For example, some species, such as the Dark-eyed Junco and Chipping Sparrow, can effectively use habitat that is adjacent to human footprint[1]. Other species prefer habitat that is more distant from human footprint, Woodland Caribou being the most well-known example.
Therefore, we measure native habitat using four different buffer distances (0 m, > 50 m, > 200 m, and > 500 m) away from footprint. These distances delimit the amount of native habitat available with a given “buffer” from human footprint. For example, at 0 m from human footprint, all native habitat in the region is included. However, at > 50 m, only native habitat that is at least 50 m away from human footprint is included. These numbers are valuable because species respond differently to human activity with some requiring more distance from footprint.
Details for calculating interior native habitat can be found in the Methods. The status of interior habitat is summarized for Norbord’s operating areas.
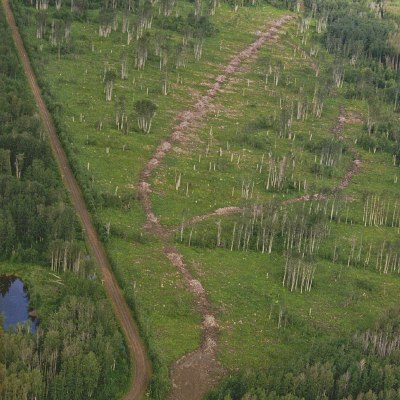
Human footprint, such as roads, seismic lines, and forestry, affects the area of interior native habitat.
Results
Interior Native Habitat
Interior native habitat, circa 2018, was found to be:
Northern Operating Area
![]()
91.2%
Southern Operating Area
![]()
69.4%
Partner Operating Area
![]()
81.6%
2018 Highlights
- The area of interior native habitat was highest in the Northern Operating Area at 91.2%, almost 10 percentage points higher than the total area of native habitat in the Partner Operating Area (81.6%), and more than 20 percentage points higher than the Southern Operating Area (69.4%). The differences in interior native habitat reflect the amount of human footprint in each landbase.
- More than 50% of each operating area is composed of native habitat at least 50 m away from human footprint. But the area drops below 50% for interior habitat at least 200 m from human footprint.
- The area of interior native habitat that is at least 500 m from human footprint decreases to 26.1% in the Northern Operating Area and only 7.0% in the Southern Operating Area.
- Human development activities occur throughout each operating area. It is the distribution of this footprint, and linear footprint in particular, throughout the landscape which contributes to the fragmentation of native vegetation, reducing the area of native habitat at least 500 m from human footprint.
References
Bayne, E., H. Lankau, and J. Tigner. 2011. Ecologically-based criteria to assess the impact and recovery of seismic lines: the importance of width, regeneration, and seismic density. Report No. 192. Edmonton, AB. 98 p.
This report is in partnership with